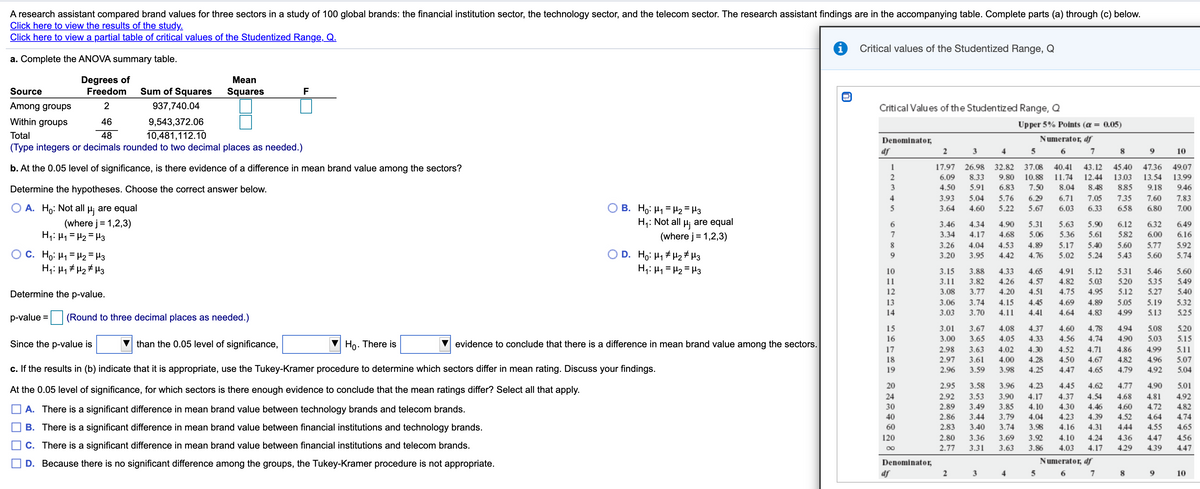
A research assistant compared brand values for three sectors in a study of 100 global brands: the financial institution sector, the technology sector, and the telecom sector. The research assistant findings are in the accompanying table. Complete parts (a) through (c) below. Click here to view the results of the study, Click here to view a partial table of critical values of the Studentized Range. Q Critical values of the Studentized Range, Q a. Complete the ANOVA summary table. Degrees of Freedom Sum of Squares Mean Source Squares F Among groups 937,740.04 2 Critical Values of the Studentized Range, Q Within groups 9,543,372.06 10,481,112.10 (Type integers or decimals rounded to two decimal places as needed.) 46 Upper 5% Polnts (a- a05) Total 48 Denominater, Numerater, df 2 34 S 6 b. At the 0.05 level of significance, is there evidence of a difference in mean brand value among the sectors? 17.97 26.98 32.82 37.08 40.41 43.12 45.40 47.36 49 2 6.09 833 5.91 9.80 10.8 11.74 12.44 13.03 885 13.54 13. Determine the hypotheses. Choose the correct answer below. 4.50 6.83 7.50 8.04 8.4 9.18 3.93 5.04 5.76 6.29 6.71 7.05 7.35 7.60 7. O A. H: Not all are equal 3.64 4.60 5.22 5.67 6.03 6.33 658 6.80 7. H;: Not all H are equal (where j= 1,2,3) OD. H H 2*s (where j= 1,2,3) 3.46 4.34 4.90 5.31 5.63 5.90 6.12 582 632 4.68 4.53 4.42 3.34 4.17 5.06 5.36 5.61 540 6.00 6. 3.26 4.04 4.9 5.17 5.02 5.24 5.60 5.77 5. 9 3.20 3.95 4.76 543 5.60 5. 10 3.15 3.11 3.08 3.88 4.33 4.66 4.91 5.12 4.82 5.00 4.75 4.95 531 5.46 5. 11 12 3.82 3.77 4.26 4.20 4.57 4.51 520 S.12 535 5.27 Determine the p-value. 13 14 3.06 3.74 3.03 3.70 4.15 4.11 4.41 4.64 4.8 4.45 4.69 4.89 5.05 5.19 513 5. 4.99 p-value = (Round to three decimal places as needed.) 15 16 3.01 3.00 3.67 3.65 4.08 4.05 4.37 4.60 4.78 4.33 4.94 508 503 evidence to conclude that there is a difference in mean brand value among the sectors. 4.56 4.74 490 Since the p-value is V than the 0.05 level of significance, V Ho. There is 4.52 4.71 17 18 2.98 2.97 2.96 3.63 3.61 3.59 4.02 4.00 3.98 4.30 4.28 4.25 486 482 4.79 4.99 5. 496 492 4.50 4.67 5. c. I the results in (b) indicate that it is appropriate, use the Tukey-Kramer procedure to determine which sectors differ in mean rating. Discuss your findings. 19 4.47 4.65 20 2.95 3.58 3.96 4.23 4.45 4.62 4.54 4.77 4.90 At the 0.05 level of significance, for which sectors is there enough evidence to conclude that the mean ratings differ? Select all that apply. 24 30 2.92 3.53 2.89 3.49 2.86 3.90 3.85 3.79 3.74 4.17 4.37 4.68 4.81 4.72 4. OA. There is a significant difference in mean brand value between technology brands and telecom brands. 4.10 4.30 4.23 4.46 460 4. 40 3.44 4.04 4.39 4.52 4.64 4. O B. There is a significant difference in mean brand value between financial institutions and technology brands. Oc. There is a significant difference in mean brand value between financial institutions and telecom brands. OD. Because there is no significant difference among the groups, the Tukey-Kramer procedure is not appropriate. 60 2.83 3.40 3.98 4.16 4.31 444 4.55 4. 120 2.80 3.36 2.77 3.31 3.69 3.63 3.92 4.24 4.10 4.03 4.17 4.36 447 00 3.86 429 4.39 DenominateE Numerater, f


Inverse Normal Distribution
The method used for finding the corresponding z-critical value in a normal distribution using the known probability is said to be an inverse normal distribution. The inverse normal distribution is a continuous probability distribution with a family of two parameters.
Mean, Median, Mode
It is a descriptive summary of a data set. It can be defined by using some of the measures. The central tendencies do not provide information regarding individual data from the dataset. However, they give a summary of the data set. The central tendency or measure of central tendency is a central or typical value for a probability distribution.
Z-Scores
A z-score is a unit of measurement used in statistics to describe the position of a raw score in terms of its distance from the mean, measured with reference to standard deviation from the mean. Z-scores are useful in statistics because they allow comparison between two scores that belong to different normal distributions.
Please answer all questions, tables and data all included
| Source | Degree of Freedom | Sum of Squares | F | |
| Among Groups | 2 | 937,740.04 | ? | ? |
| Within Groups | 46 | 9,543,372.06 | ? | ? |
| Total | 48 | 10,481,112.10 |
| Group | N | Mean |
| Financial Institution | 18 | 24,494.79 |
| Technology | 18 | 59,621.64 |
| Telecom | 13 | 37,228.81 |


Trending now
This is a popular solution!

Step by step
Solved in 3 steps


