A researcher collected data on ( X , Y ), and wanted to test if the true relationship is linear. Therefore, she collected replicated values of X. Here is a summary of the data, and some results: Xi No. of replicates y; SSE = 312. 1 3 9 10 2 5 11 8 3 12 14 4 4 15 13 5 3 9 6 11 10 7 8. 4 8 3 7 CO 2.
A researcher collected data on ( X , Y ), and wanted to test if the true relationship is linear. Therefore, she collected replicated values of X. Here is a summary of the data, and some results: Xi No. of replicates y; SSE = 312. 1 3 9 10 2 5 11 8 3 12 14 4 4 15 13 5 3 9 6 11 10 7 8. 4 8 3 7 CO 2.

MATLAB: An Introduction with Applications
6th Edition
ISBN:9781119256830
Author:Amos Gilat
Publisher:Amos Gilat
Chapter1: Starting With Matlab
Section: Chapter Questions
Problem 1P

Related questions
Question
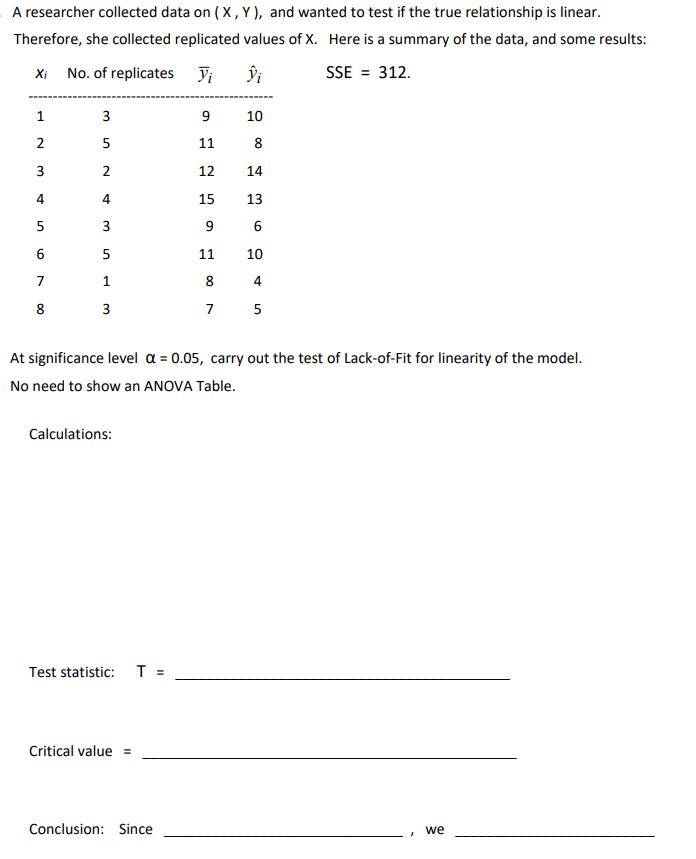
Transcribed Image Text:A researcher collected data on ( X, Y ), and wanted to test if the true relationship is linear.
Therefore, she collected replicated values of X. Here is a summary of the data, and some results:
Xi No. of replicates yi
SSE = 312.
1
3
9
10
5
11
8.
3
2
12
14
4
4.
15
13
3
9
6
6
5
11
10
7
1
8
4
8
3
7
5
At significance level a = 0.05, carry out the test of Lack-of-Fit for linearity of the model.
No need to show an ANOVA Table.
Calculations:
Test statistic: T =
Critical value =
Conclusion: Since
we
2.
Expert Solution
This question has been solved!
Explore an expertly crafted, step-by-step solution for a thorough understanding of key concepts.

Step by step
Solved in 3 steps

Recommended textbooks for you
MATLAB: An Introduction with Applications
Statistics
ISBN:
9781119256830
Author:
Amos Gilat
Publisher:
John Wiley & Sons Inc

Probability and Statistics for Engineering and th…
Statistics
ISBN:
9781305251809
Author:
Jay L. Devore
Publisher:
Cengage Learning

Statistics for The Behavioral Sciences (MindTap C…
Statistics
ISBN:
9781305504912
Author:
Frederick J Gravetter, Larry B. Wallnau
Publisher:
Cengage Learning
MATLAB: An Introduction with Applications
Statistics
ISBN:
9781119256830
Author:
Amos Gilat
Publisher:
John Wiley & Sons Inc
Probability and Statistics for Engineering and th…
Statistics
ISBN:
9781305251809
Author:
Jay L. Devore
Publisher:
Cengage Learning
Statistics for The Behavioral Sciences (MindTap C…
Statistics
ISBN:
9781305504912
Author:
Frederick J Gravetter, Larry B. Wallnau
Publisher:
Cengage Learning

Elementary Statistics: Picturing the World (7th E…
Statistics
ISBN:
9780134683416
Author:
Ron Larson, Betsy Farber
Publisher:
PEARSON

The Basic Practice of Statistics
Statistics
ISBN:
9781319042578
Author:
David S. Moore, William I. Notz, Michael A. Fligner
Publisher:
W. H. Freeman

Introduction to the Practice of Statistics
Statistics
ISBN:
9781319013387
Author:
David S. Moore, George P. McCabe, Bruce A. Craig
Publisher:
W. H. Freeman