A researcher conducts a diagnostic examination to 20 students. The following are the interpretation of the diagnostic examination. 1 Sasha got a score which is 60% higher than those who took the diagnostic test. 2 Marvin has a percentile rank of 90. 3. Zendee got a score which is only 5% higher than those who took the diagnostic test. 4. Meiko has a percentile rank of 75. 5 Spencer is g0% lower than those who took the diagnostic test Construct the t-distribution curve that illustrate each percentile, then identify the t-value of the percentiles of the following by filling up the table: Student Illustration t-value 1. Sasha 2. Marvin 3. Zendee 4 Meiko 5 Spencer Questions: 1. Who do you think got the highest score? 2. Who do you think passed the diagnostic examination?
A researcher conducts a diagnostic examination to 20 students. The following are the interpretation of the diagnostic examination. 1 Sasha got a score which is 60% higher than those who took the diagnostic test. 2 Marvin has a percentile rank of 90. 3. Zendee got a score which is only 5% higher than those who took the diagnostic test. 4. Meiko has a percentile rank of 75. 5 Spencer is g0% lower than those who took the diagnostic test Construct the t-distribution curve that illustrate each percentile, then identify the t-value of the percentiles of the following by filling up the table: Student Illustration t-value 1. Sasha 2. Marvin 3. Zendee 4 Meiko 5 Spencer Questions: 1. Who do you think got the highest score? 2. Who do you think passed the diagnostic examination?

Glencoe Algebra 1, Student Edition, 9780079039897, 0079039898, 2018
18th Edition
ISBN:9780079039897
Author:Carter
Publisher:Carter
Chapter4: Equations Of Linear Functions
Section4.5: Correlation And Causation
Problem 15PPS

Related questions
Question
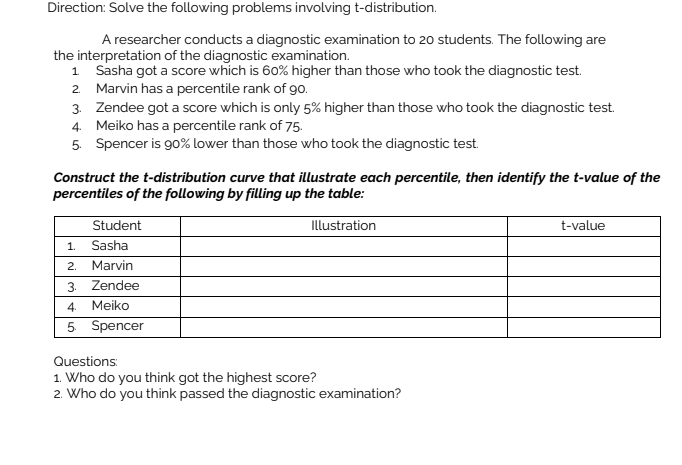
Transcribed Image Text:Direction: Solve the following problems involving t-distribution.
A researcher conducts a diagnostic examination to 20 students. The following are
the interpretation of the diagnostic examination.
1 Sasha got a score which is 60% higher than those who took the diagnostic test.
2 Marvin has a percentile rank of go.
3. Zendee got a score which is only 5% higher than those who took the diagnostic test.
4. Meiko has a percentile rank of 75.
5 Spencer is 90% lower than those who took the diagnostic test.
Construct the t-distribution curve that illustrate each percentile, then identify the t-value of the
percentiles of the following by filling up the table:
Student
Illustration
t-value
1.
Sasha
2.
Marvin
3. Zendee
4. Meiko
5 Spencer
Questions:
1. Who do you think got the highest score?
2. Who do you think passed the diagnostic examination?
Expert Solution
This question has been solved!
Explore an expertly crafted, step-by-step solution for a thorough understanding of key concepts.

This is a popular solution!

Trending now
This is a popular solution!

Step by step
Solved in 2 steps with 2 images

Recommended textbooks for you
Glencoe Algebra 1, Student Edition, 9780079039897…
Algebra
ISBN:
9780079039897
Author:
Carter
Publisher:
McGraw Hill

Linear Algebra: A Modern Introduction
Algebra
ISBN:
9781285463247
Author:
David Poole
Publisher:
Cengage Learning

Big Ideas Math A Bridge To Success Algebra 1: Stu…
Algebra
ISBN:
9781680331141
Author:
HOUGHTON MIFFLIN HARCOURT
Publisher:
Houghton Mifflin Harcourt
Glencoe Algebra 1, Student Edition, 9780079039897…
Algebra
ISBN:
9780079039897
Author:
Carter
Publisher:
McGraw Hill
Linear Algebra: A Modern Introduction
Algebra
ISBN:
9781285463247
Author:
David Poole
Publisher:
Cengage Learning
Big Ideas Math A Bridge To Success Algebra 1: Stu…
Algebra
ISBN:
9781680331141
Author:
HOUGHTON MIFFLIN HARCOURT
Publisher:
Houghton Mifflin Harcourt

Functions and Change: A Modeling Approach to Coll…
Algebra
ISBN:
9781337111348
Author:
Bruce Crauder, Benny Evans, Alan Noell
Publisher:
Cengage Learning