O Health insurers are beginning to offer telemedicine services online that replace the common office visit. Wellpoint provides a video service that allows subscribers to connect with a physician online and receive prescribed treatments. Wellpoint claims that users of its LiveHealth Online service saved a significant amount of money on a typical visit. The data shown below ($), for a sample of 20 online doctor visits, are consistent with the savings per visit reported by o Wellpoint. O 90 33 41 O 104 82 56 55 50 37 76 46 96 93 73 74 79 92 99 56 82 Assuming the population is roughly symmetric, construct a 95% confidence interval for the mean savings for a televisit to the doctor as opposed to an office visit (to 2 decimals). 95% confidence interval:S to per visit
O Health insurers are beginning to offer telemedicine services online that replace the common office visit. Wellpoint provides a video service that allows subscribers to connect with a physician online and receive prescribed treatments. Wellpoint claims that users of its LiveHealth Online service saved a significant amount of money on a typical visit. The data shown below ($), for a sample of 20 online doctor visits, are consistent with the savings per visit reported by o Wellpoint. O 90 33 41 O 104 82 56 55 50 37 76 46 96 93 73 74 79 92 99 56 82 Assuming the population is roughly symmetric, construct a 95% confidence interval for the mean savings for a televisit to the doctor as opposed to an office visit (to 2 decimals). 95% confidence interval:S to per visit

Glencoe Algebra 1, Student Edition, 9780079039897, 0079039898, 2018
18th Edition
ISBN:9780079039897
Author:Carter
Publisher:Carter
Chapter4: Equations Of Linear Functions
Section4.5: Correlation And Causation
Problem 2CYU

Related questions
Question
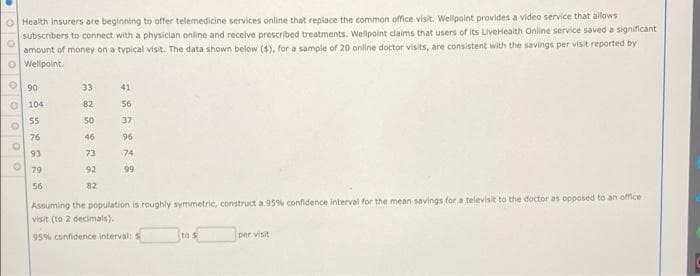
Transcribed Image Text:O Health insurers are beginning to offer telemedicine services online that replace the common office visit. Wellpoint provides a video service that allows
subscribers to connect with a physician online and receive prescribed treatments. Wellpoint claims that users of Its LiveHealth Online service saved a significant
amount of money on a typical visit. The data shown below ($), for a sample of 20 online doctor visits, are consistent with the savings per visit reported by
O Wellpoint.
O 90
33
41
O 104
82
56
55
50
37
76
46
96
93
73
74
79
92
99
56
82
Assuming the population is roughly symmetrie, construct a 95% confidence interval for the mean savings for a televisit to the doctor as opposed to an office
visit (to 2 decimals).
95% confidence interval: S
to s
per visit
oooo o
Expert Solution
This question has been solved!
Explore an expertly crafted, step-by-step solution for a thorough understanding of key concepts.

This is a popular solution!

Trending now
This is a popular solution!

Step by step
Solved in 3 steps with 1 images

Recommended textbooks for you
Glencoe Algebra 1, Student Edition, 9780079039897…
Algebra
ISBN:
9780079039897
Author:
Carter
Publisher:
McGraw Hill
Glencoe Algebra 1, Student Edition, 9780079039897…
Algebra
ISBN:
9780079039897
Author:
Carter
Publisher:
McGraw Hill