A researcher conducts a mileage economy test involving 105 cars. The frequency distribution describing average miles per gallon (mpg) appears in the following table. Average mpg 15 ≤ x < 20 Frequency 8 20 ≤ x < 25 25 x 30 28 15 30 x 35 35 ≤ x < 40 40 ≤ x < 45 9 27 18 a-1. Construct the relative frequency distribution. Note: Round "Relative Frequency" to 4 decimal places. Average mpg Relative Frequency 15 ≤x≤20 20 ≤ x < 25 25 ≤ x < 30 30 ≤ x < 35 35 ≤ x <40 40 ≤ x < 45 a-2. What proportion of the cars got at least 40 mpg but less than 45 mpg? Note: Round your answer to 4 decimal places. Proportion of cars a-3. What proportion of the cars got less than 35 mpg? Note: Round your answer to 4 decimal places. Proportion of cars a-4. What proportion of the cars got 35 mpg or more? Note: Round your answer to 4 decimal places. Proportion of cars
A researcher conducts a mileage economy test involving 105 cars. The frequency distribution describing average miles per gallon (mpg) appears in the following table. Average mpg 15 ≤ x < 20 Frequency 8 20 ≤ x < 25 25 x 30 28 15 30 x 35 35 ≤ x < 40 40 ≤ x < 45 9 27 18 a-1. Construct the relative frequency distribution. Note: Round "Relative Frequency" to 4 decimal places. Average mpg Relative Frequency 15 ≤x≤20 20 ≤ x < 25 25 ≤ x < 30 30 ≤ x < 35 35 ≤ x <40 40 ≤ x < 45 a-2. What proportion of the cars got at least 40 mpg but less than 45 mpg? Note: Round your answer to 4 decimal places. Proportion of cars a-3. What proportion of the cars got less than 35 mpg? Note: Round your answer to 4 decimal places. Proportion of cars a-4. What proportion of the cars got 35 mpg or more? Note: Round your answer to 4 decimal places. Proportion of cars

Glencoe Algebra 1, Student Edition, 9780079039897, 0079039898, 2018
18th Edition
ISBN:9780079039897
Author:Carter
Publisher:Carter
Chapter10: Statistics
Section10.4: Distributions Of Data
Problem 19PFA

Related questions
Question
100%
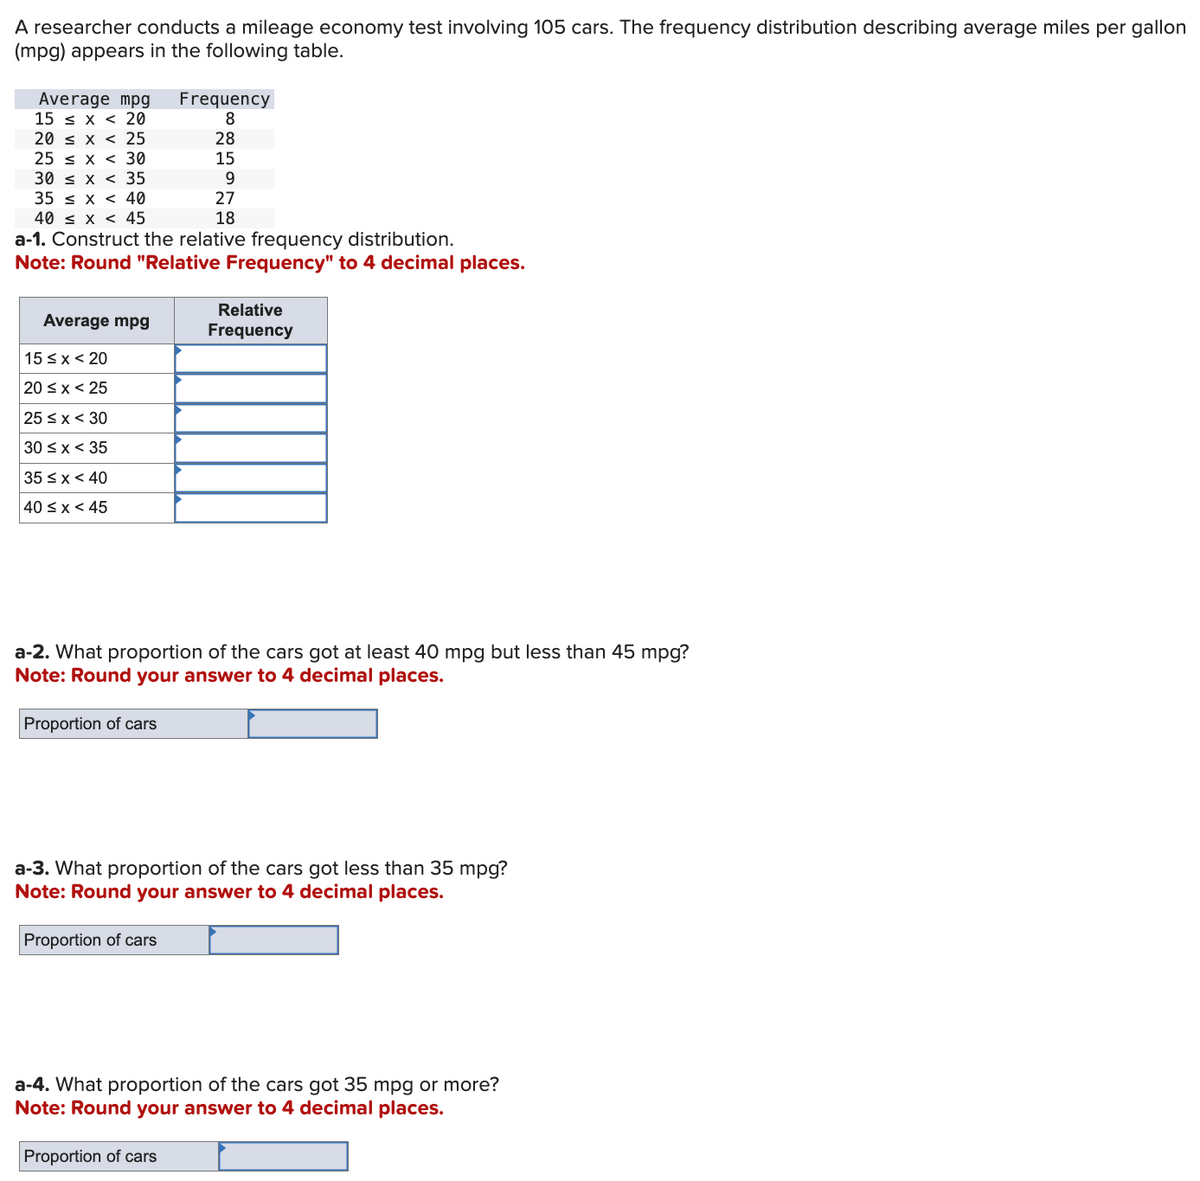
Transcribed Image Text:A researcher conducts a mileage economy test involving 105 cars. The frequency distribution describing average miles per gallon
(mpg) appears in the following table.
Average mpg Frequency
15 x 20
8
20 ≤ x < 25
28
25 x
30
15
30
x
35
9
35
x
40
40 x
45
27
18
a-1. Construct the relative frequency distribution.
Note: Round "Relative Frequency" to 4 decimal places.
Average mpg
Relative
Frequency
15 ≤ x < 20
20 ≤ x < 25
25 ≤ x < 30
30 ≤ x < 35
35 ≤ x < 40
40 ≤ x < 45
a-2. What proportion of the cars got at least 40 mpg but less than 45 mpg?
Note: Round your answer to 4 decimal places.
Proportion of cars
a-3. What proportion of the cars got less than 35 mpg?
Note: Round your answer to 4 decimal places.
Proportion of cars
a-4. What proportion of the cars got 35 mpg or more?
Note: Round your answer to 4 decimal places.
Proportion of cars
Expert Solution
This question has been solved!
Explore an expertly crafted, step-by-step solution for a thorough understanding of key concepts.

This is a popular solution!

Trending now
This is a popular solution!

Step by step
Solved in 3 steps with 30 images

Recommended textbooks for you
Glencoe Algebra 1, Student Edition, 9780079039897…
Algebra
ISBN:
9780079039897
Author:
Carter
Publisher:
McGraw Hill
Glencoe Algebra 1, Student Edition, 9780079039897…
Algebra
ISBN:
9780079039897
Author:
Carter
Publisher:
McGraw Hill