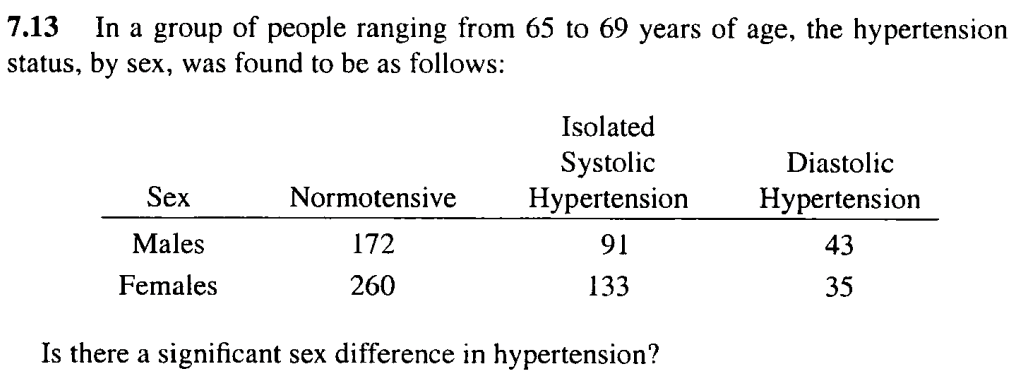
7.13 In a group of people ranging from 65 to 69 years of age, the hypertension status, by sex, was found to be as follows: Isolated Systolic Diastolic Sex Normotensive Hypertension Hypertension Males 172 91 43 Females 260 133 35 Is there a significant sex difference in hypertension?


Q: Blood Type B+ is relatively rare in the population, with a probability of .085. We will work on a…
A: The probability of B+ blood is 0.085The number of trials 3
Q: Consider the following data representing the price of plasma televisions (in dollars).…
A: Class IntervalFrequencyClass BoundariesMidpointRelative FrequencyCumulative…
Q: A factory produces a particular electrical component. On average, the probability that a component…
A: The objective of this question is to find the probability of having at least one faulty component in…
Q: 3. Use the training data of Gauss2 example (Gauss2.train). (a). Run the K-means algorithm with K = 2…
A: (a) Running K-means with K = 2 clusters:# Load the data data <- read.csv("Gauss2.train.csv") #…
Q: A public opinion poll surveyed a simple random sample of 1000 voters. Respondents were classified by…
A: There are a gender gap,the men's voting preferences differ significantly from the women's…
Q: Using the accompanying New Account Processing data, perform chi-square tests for independence to…
A: The new account processing data of gender and their certification is provided as…
Q: Which graph represents a negative linear relationship between x and y? A. B. a. B b. C CA d. None of…
A: There scatter plots are given.It is needed to find a scatterplot that depicts a negative linear…
Q: In a recent survey, 500 participants were asked about their favorite genre of movies. The results…
A: Answers:1. To calculate the number of participants who preferred action movies: - Multiply the…
Q: An article describes the chemical compositions of certain minerals in the early Archaean mantle. For…
A: The objective of the question is to find the mean and standard deviation of the sample mean SiO2…
Q: Is the average number of people who visit the ER every day decreasing? It is known the average…
A: The objective of this question is to calculate the upper bound of a 95% confidence interval for the…
Q: The Acme Company manufactures widgets. The distribution of widget weights is bell-shaped with a mean…
A: a.Suppose the random variable x defines the weight of a randomly selected widget.According to the…
Q: The heights of 1500 students are normally distributed with a mean of 176.5 centimeters and a…
A: The question is about normal distribution.Given :Total number of students ( N ) = 1500Population…
Q: A company sells their products online. The partially completed table below shows the probability for…
A: The daily expected number of sales is 1.46.Explanation:A probability distribution is a distribution…
Q: Heights for group of people normally distributed with mean = 63 inches and standard deviation 2.9…
A: The objective of this question is to find the height that corresponds to the 20th percentile of a…
Q: A distribution of values is normal with a mean of 162.7 and a standard deviation of 51.6. Find P38,…
A: Given ,A distribution of values is normal with a mean , 162.7 and standard deviation , 51.6We have…
Q: Hughes randomly samples 100 people and shows both menus to each person, asking them to rate each…
A: The objective of the question is to determine if there is a statistically significant difference in…
Q: The probability of winning the first prize in a lottery of a man is 15/100. If the total of 3500…
A:
Q: The lifetime, in years, of a type of small electric motor operating under adverse conditions is…
A: The objective of this question is to find the probability that fewer than six motors fail within one…
Q: A company sells their products online. The partially completed table below shows the probability of…
A: The probability that the company sells at least one product First, find the missing probability then…
Q: ind the area of the shaded region. The graph depicts the standard normal stribution with mean 0 and…
A: Z follows the standard normal distribution with a mean of zero and a standard deviation of one.
Q: The amount of paint required to paint a surface with an area of 50 m2 is normally distributed with…
A: The given data is as follows:Population mean, Population standard deviation,
Q: A taxi company is trying to decide whether to purchase brand A or brand B tires for its fleet of…
A: The question is about confidence interval.Given :
Q: Tupps Motors which was established in year 2000, sells 5 brands of new passenger vehicles Holden,…
A: The solution involved creating a bar chart to compare the sales of the top 10 passenger vehicle…
Q: Two batteries, with voltages V1 and V2, are connected in series. The total voltage V is given by V =…
A: The objective of this question is to find the mean (μV) and standard deviation (σV) of the total…
Q: You are conducting a study to see if the proportion of voters who prefer Candidate A is…
A: P = proportion of voters who prefer candidate AClaim : p>0.81Test statistic : z = 2.845P value =…
Q: Below are the income per capita of a sample of different households. Per Capita Income 21,500 37,325…
A: The data related to the per capita income of different households are given.
Q: Claim: The mean pulse rate (in beats per minute) of adult males is equal to 69 bpm. For a random…
A: From the provided information,Claim is that the mean pulse rate (in beats per minute) of adult males…
Q: Which of the following items represent the most common source of bias in Randomized controlled…
A: The objective of the question is to identify the most common source of bias in Randomized Controlled…
Q: 2. A rat runs through the maze shown below. At each step it leaves the room it is in by choosing at…
A: Given that a rat runs through the maze shown below, at each step it leaves the room it is in by…
Q: Suppose that the lifetime of a component (in hours), X, is modeled with a Weibull distribution with…
A: Please refer to the explanation.Explanation:Step 1: Step 2:Step 3: Step 4:
Q: The amount of paint required to paint a surface with an area of 50 m2 is normally distributed with…
A: The objective of this question is to find the probability that the entire surface can be painted…
Q: An experiment is run.It succeeds thrice as often as it fails.Find the probability of exactly 4…
A:
Q: The U.S. Center for Disease Control reports that the mean life expectancy was 47.6 years for whites…
A: a.) The Hypotheses The hypotheses are: H0:μW=μNWH1:μW=μNW b.) The Test Statistic The…
Q: Consider a birth and death process with states {0,1}. Let the birth and death rates be Ao a > 0, A₁…
A: Consider a birth and death process with states {0,1}. Let the birth and death rates be and .
Q: The null and alternate hypotheses are: H0 : μ1 = μ2 H1 : μ1 ≠ μ2 A random sample of 10…
A: The given data is as follows:The hypothesis Population 1Sample size, Sample mean, Sample standard…
Q: Problem #3: (a) Suppose that we identify 152 women 50 to 54 years of age who have both a mother and…
A: The given data is as follows:Sample size, Number of women with breast cancer, Population proportion,…
Q: the food marketing insititute reports that 28% of households spend less than $100 per week on…
A: the probability that less than 102 households spend less than $100 per week on groceries is…
Q: Assume that different groups of couples use a particular method of gender selection and each couple…
A:
Q: can you do the next part of the question please
A: In order to estimate the parameters, we need to calculate the sample mean and sample variance of…
Q: Let T ∼ Γ (r, λ). If μT = 8 and r = 8.00, find λ and σ2T . (Round the final answer to one decimal…
A: T~Γ(r,λ)If μT = 8 and r = 8.00Formula Mean=rλVariance=rλ2
Q: 10.22 An automobile manufacturer is considering using robots for part of its assembly process.…
A: The given information states that an automobile manufacturer is assuming robots for part of its…
Q: 1. You are trying to find the average weight of a breed of fish in a river. You catch the fish,…
A: Simple random sampling with replacement Explanation:Step 1: Define the 4 sampling methods…
Q: A newspaper reports that the average consumer in a certain neighborhood spends $565 per month on…
A: The objective of this question is to calculate the margin of error for a 95% confidence interval…
Q: A grocery store's receipts show that Sunday customer purchases have a skewed distribution with a…
A: The question is about sampling distribution.Given :Population mean purchases ( ) = $32Population…
Q: 06 PART ONE Ten Steps to Advancing College Reading Skills REVIEW TEST 3 A. (1-4.) Read the graph…
A: We have given the bar graph of percent of US population reads newspapers.
Q: Show proof of the following. Provide all derivations used. 2. Consider a multinomial distribution…
A: A multinomial distribution is considered with possible outcomes.It must be proved that 's…
Q: A data center contains 1000 computer servers. Each server has probability 0.004 of failing on a…
A: From the provided information,n = 1000Probability of failing server on a given day (p) = 0.004
Q: Tensile strength tests were carried out on two different grades of wire rod resulting in the…
A: 95% confidence interval for difference between true average strengths for the two grades: (-16.741,…
Q: 10. The median of the observation 11, 12, 14, 18, x +4, 30, 32, 35, 41 arranged in ascending order…
A: From the provided information,The median of the observation is 24.Number of observation (n) = 9
Q: The accompanying dataset contains the listed prices (in thousands of dollars) and the number of…
A: The data set has been provided that contains the listed prices and the number of square feet for 28…

Unlock instant AI solutions
Tap the button
to generate a solution
Click the button to generate
a solution
- Dr. Stevenson reported the following in a journal: “F (4, 106) = 10.09, p = .04.” Should Dr. Stevenson state that there are significant differences among the variable means at a .01 alpha level?Suppose it was found that in a random sample of 200 individuals who were underweight (defined as having a BMI of under 18.5), 8 of them were hospitalized with COVID-19. Of a corresponding group of 400 individuals who were classified as severely obese (defined as having a BMI of at least 45.0), 32 were hospitalized with COVID-19. (a) What are the two sample proportions (to 4 decimal places)? (b) What is the difference between the two sample proportions (to 4 decimal places)? (c) If you were testing whether the probability of being hospitalized with COVID-19 differed between the population of underweight individuals and the population of severely obese individuals, what would be your null hypothesis, either in words or in mathematical terms?Dr. Romanoff reported the following in a journal: “F (5, 106) = 10.09, p = .04.” Should Dr. Romanoff state that there are significant differences among the variable means at a .05 alpha level?
- The number of contaminating particles on a silicon waferprior to a certain rinsing process was determined for eachwafer in a sample of size 100, resulting in the followingfrequencies:Number of particles 0 1 2 3 4 5 6 7Frequency 1 2 3 12 11 15 18 10Number of particles 8 9 10 11 12 13 14Frequency 12 4 5 3 1 2 1a. What proportion of the sampled wafers had at leastone particle? At least five particles?b. What proportion of the sampled wafers had betweenfive and ten particles, inclusive? Strictly between fiveand ten particles?c. Draw a histogram using relative frequency on thevertical axis. How would you describe the shape of thehistogram?A survey of 90 recently delivered women on the rolls of a county welfare department revealed that 27 had a history of intrapartum or postpartum infection. Can we conclude that the population proportion with a history of intrapartum or postpartum infection is less than or equal to 0.25. Let alpha = 0.0531% of all pygmy softshell tortoises have stripes on their shells. A herpetologist in Cititon collects a sample of 28 pygmy softshell tortoises and finds that 8 of them have stripes on their shells. Is there enough evidence to conclude, at a significance of alpha = 0.05, that the proportion of pygmy softshell tortoises in Cititon with stripes on their shells is less than 31%? What is the claim? What is the null hypothesis? What is the alternative hypothesis? What is the test statistic? What is/are the critical value(s)? Do we reject the null hypothesis? What conclusion do we draw? What is the P-value for the problem above?
- 31% of all pygmy softshell toises have stripes on their shells. A herpetologist in Cititon collects a sample of 28 pygmy softshell tortoises and finds that 8 of them have stripes on their shells. Is there enough evidence to conclude, at a significance of alpha=0.05, that the proportion of pygmy softshell tortoises in Cititon with stripes on their shells is less than 31%? What is the claim? What is the null hypothesis? What is the alternative hypothesis? What is the test statistic? What is/are the critical value(s)? Do we reject the null hypothesis? What conclusion do we draw? What is the P-value for the problem above?A sample of men and women who had passed their driver's test either the first time or the second time were surveyed, with the following results: Results of the driving testGender First time Second timeMen 126 211Women 135 178a) Do these data suggest that there is a relationship between gender and the passing of their driver’s test from which the present sample was drawn? Let alpha=.05The British Department of Transportation studied to see if people avoid driving on Friday the 13th. They did a traffic count on a Friday and then again on a Friday the 13th at the same two locations. The data for each location on the two different dates is in the table. Do the data show that on average fewer people drive on Friday the 13th? Test at the 5% level.Traffic Count Dates 6th 13th 1990, July 137669 135825 1990, July 129699 128891 1991, September 136898 138275 1991, September 138966 139940 1991, December 132021 129640 1991, December 119268 119214 1992, March 131938 131104 1992, March 123306 124760 1992, November 129499 129219 1992, November 138568 135934
- A random sample of 50 COS students contained 13 that owned an iPhone. A random sample of 200 Fresno State students contained 70 that owned an iPhone. Use these data to test the claim that the proportion of COS students who own an iPhone is the same as the proportion of Fresno State students who own an iPhone at the 0.05 level of significance.Interpret the following statement regarding the statistical findings of a research study. “61% (n = 36) of recipients of the low-carbohydrate diet and 23% (n = 14) of recipients of the low-fat diet completed the study and lost greater than 10% of their initial body weight (P < 0.001).” Number of participants who completed the study and lost greater than 10% of their body weight: P-value: Does this p-value indicate a statistically-significant difference in the average weight loss between the two groups:A survey of 90 recently delivered women on the rolls of a county welfare department revealed that 27 had a history of intrapartum or postpartum infection. Can we conclude that the population proportion with a history of intrapartum or postpartum infection is significantly less than or equal to 0.25? Let alpha = 0.05.