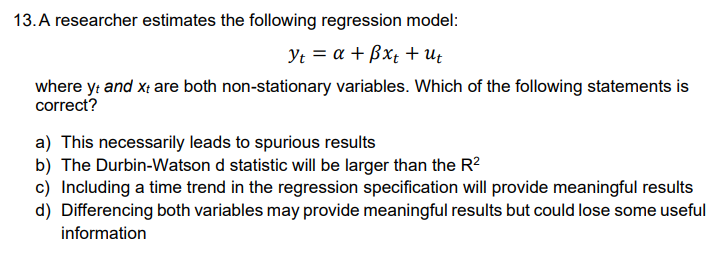
A researcher estimates the following regression model: Yt = a + ßxt + Ut where yt and xt are both non-stationary variables. Which of the following statements is correct? a) This necessarily leads to spurious results b) The Durbin-Watson d statistic will be larger than the R² c) Including a time trend in the regression specification will provide meaningful results d) Differencing both variables may provide meaningful results but could lose some useful information


Q: Poisson model in traffic safety • Here we make the assumption of a Poisson process. (What does that…
A: Here we make the assumption of a Poisson process implies that, Accidents occur at the traffic…
Q: 1. A study wished to see if husbands or wives are more satisfied in their marriage. They selected…
A: We have attempted only first 3 parts as per guidelines of Bartleby.
Q: 6.9. A router is used to cut locating notches on a printed circuit board. The vibration level at the…
A: we have given as 2 level 2 factor design A: bit size B: Cutting size
Q: Chapin Manufacturing Company operates 24 hours a day, 5 days a week. The workers rotate shifts each…
A: For the given dataset, we will be performing the two-way ANOVA, therefore deduce the conclusion…
Q: In XYZ City, given the Composite Consumer Price Index (CPI) is 111.1 (in Year 2004) and 122.2 (in…
A: The Consumer Price Index for the year 2004 is given as, CPI2004=111.1. The Consumer Price Index for…
Q: The mean weight baggage carried into an airplane by individual passengers at Clark International…
A: From the provided information, Sample size (n) = 1110 Sample mean (x̄) = 18.5 Sample standard…
Q: You wish to test the following claim (Ha) at a significance level of a = 0.05. Ho: μ = 76.3 Ha:…
A: Sample size =29 Sample mean (M)=78.7 Standard deviation =7.2 We have to find Test statistic P value…
Q: In each of the following situations, indicate whether Walters, CPA is using unrestricted random…
A: We need to determine if the given questions were chosen using UR, SR, H, or B.
Q: Data set One Results below represent caloric content of different foods 390 405 580 300 320 540 225…
A: We have given data are x:…
Q: According to one source, 51% of plane crashes are due at least in part to pilot error. Suppose that…
A: claim : p ≠ 0.51n =100x = 66α = 0.05
Q: An electrician wants to know whether batteries made by two manufacturers have significantly…
A: From the provided information, n1=50x1=130σ1=1n2=50x2=129σ2=4
Q: You may need to use the appropriate appendix table or technology to answer this question. Mileage…
A: Answer: From the given data, Margin of error (E) = 1 Population standard deviation σ = 2.5 For a 95%…
Q: D 11 12 13 14 The Service Corps of Retired Executives collected the data below to see if their small…
A: We have to check condition or assumptions
Q: What is the appropriate statistical test to identify any significant difference between Gender…
A: The dataset for gender group and patients' albumin level is given. We have to obtain the test which…
Q: Assume that the following data represent baseball batting averages for a random sample of National…
A: Given, Base ball batting averages are:- Now we have to multiply each data value by 1000 to clear…
Q: The sample space shows all possible sequences of child gender for a family with 3 children. The…
A: sample space : 0 girls 1 girls 2 girls 3 girls BBB GBB BGG GGG BGB GBG BBG GGB…
Q: Percentage variance and turkey HSD
A: For this problem, we need to use the ANOVA (Analysis of Variance) test to examine if there are any…
Q: Household size in the United States has a population mean of μ = 2.6 people and population standard…
A: 5) Answer:- Given, Population mean, µ = 2.6 Population standard deviation, σ = 1.4 Sample size, n =…
Q: For example, from a mortality table, you only know the follow information: Cx lx 30 31 32 33 34…
A: In this problem, we are given a mortality table that provides information about the mortality…
Q: 39/ iF X is a random Variable has poisson distribution with 2=4 Find P(X=3)
A: From the provided information, X is a random variable has Poisson distribution with λ = 4
Q: One ticket will be drawn at random from the box below. Are the first and second numbers independent?…
A: One ticket will be drawn at random from the box below. [ (3, 1) , ( 3, 1) , (3, 8) , (5, 1) , (5, 1)…
Q: 8. Which of the following will result from running a regression model with a high degree of…
A: The regression model represents the relationship between one dependent and two or more independent…
Q: I work this problem following your example P(student and independent) is incorrect their response is…
A: The given data is: Independent Republican Democrat Student 66 70 92 Professor 100 60 85…
Q: 1. If you increase the confidence level you would expect the confidence interval to be wider because…
A: The confidence interval is the range of values within which the value of population parameter is…
Q: How long did real cowboys live? One answer may be found in the book The Last Cowboys by Connie…
A: In stem and leaf plot, the data is divided into two parts: Stem and leaf. It is used to observe the…
Q: Mark Price, the new productions manager for Speakers and Company, needs to find out which variable…
A: Independent variables : Unit price & Advertising Dependent variable : Unit sales i.e., We wish…
Q: Use the given table, which lists six possible assignments of probabilities for tossing a coin twice,…
A: Assignments HH HT TH TT A 1/4 1/4 1/4 1/4 B 0 0 0 1 C 1/7 1/7 5/14 5/14…
Q: The ages of Daisy's five cousins are listed below. 14 5 18 13 12 1) Calculate the mean. μ= 22.25 2)…
A: It is required to calculate the population mean, µ, and population standard deviation, σ for the…
Q: 3. You are in charge of a delivery company that has a large fleet of delivery truck. The distance a…
A: The sample size is 36, the sample mean is 55 and the sample variance is 49.
Q: For each of the following functions, Find c so that the function is a PDF. a) (cx² + x) I[0,1](×).…
A: The value of C, so that the given functions are a pdf.
Q: 22) let XnN20, 036), iF P(X<W) = 0.05 th the value of wis
A: Given that, X~N(μ=20, σ=0.36) To find the value of W when P(X<W)=0.05
Q: 3. The weekly demand for propane gas (in 1000s of gallons) from a particular facility is a random…
A: “Since you have asked multiple questions, we will solve the first question for you. If you want any…
Q: Find and interpret risk difference, relative risk, and odds ratio. Use a chi-square test to test…
A: To find and interpret the risk difference, relative risk, and odds ratio, we can calculate them…
Q: Given the following data: Vegetable Sweet Carrot Yes Potato Onion Celery No Yes No Starchy Yes Yes…
A: Vegetable Sweet Starchy Firm Vitamin Water Calories/100g Carrot Yes Yes Yes A Medium 43 Potato…
Q: The average math score for the class 5 is 23.6. A researcher is interested to check if the score is…
A: The average math score for class 5 is 23.6. A researcher is interested to check if the score is…
Q: Financial Sector Conforms yes no 1 10 15 2 3 10 15 30 20 Denote by A₁, A2, A3 the events the company…
A: The question is about probability Given : To find : a ) Prob. that a rand. selected belongs to…
Q: Alfa Beta Alfa 3/4 Beta NK ½
A: The provided transition matrix of bread sales of the brands Alpha and Beta is: T=Alpha…
Q: A coin is tossed n times. What is the chance that the head will present itself an even number of…
A: A coin is tossed n times.
Q: Let Y be a discrete random variable with support on {-1,0, 1} and with probability mass function…
A: The Maximum Likelihood Estimator of θ, given that the observed value of the random variable, Y is…
Q: Use your knowledge of the expected values to find how many eggs, on average, you can expect from…
A: ANSWER: We have been given the following information: Number of White Leghorns: 10 Number of…
Q: You are conducting a study to see if the proportion of women over 40 who regularly have mammograms…
A: Answer:- Given, The test statistic is, z = 2.61, The test is right-tailed test. We use standard…
Q: nfidence interval for the value of the parameter. A sample of 10 Latin American countries was…
A:
Q: In a study of cell phone usage and brain hemispheric dominance, an Internet survey was e-mailed to…
A: It is given that- Total number of surveyed persons: n=6980 Number of surveys returned : x=1306 Level…
Q: Which of the following will result from running a regression model with a high degree of correlation…
A: Multicollinearity exists when an independent variable is highly correlated with the other…
Q: You wish to test the following claim (Ha) at a significance level of a = 0.01. Ho: μ = 61.1 Ha:μ…
A: From the provided information, Sample size (n) = 318 Sample mean (M) = 60.8 Sample standard…
Q: Data set One Results below represent caloric content of different foods 390 405 580 300 320 540 225…
A: We have given data are x:…
Q: A researcher wishes to estimate, with 99% confidence, the population proportion of families who eat…
A: Population proportion p=16%=0.16 Margin of error =E =5%=0.05
Q: Which i) ii) iii) iv) = of the following are characteristics of a stochastic process Yt It has…
A:
Q: Find the (a) mean, (b) median, (c) mode, and (d) midrange for the data and then (e) answer the given…
A: The 11 observations (i.e., n=11) are: 14, 93, 82, 77, 32, 5, 62, 35, 2, 79, 6
Q: Let X be a random variable such that P(X= c+kh) = π(a) (poisson distribution), where c s a real and…
A: In this problem, we are given a random variable X that follows a Poisson distribution with parameter…

Step by step
Solved in 3 steps

- Olympic Pole Vault The graph in Figure 7 indicates that in recent years the winning Olympic men’s pole vault height has fallen below the value predicted by the regression line in Example 2. This might have occurred because when the pole vault was a new event there was much room for improvement in vaulters’ performances, whereas now even the best training can produce only incremental advances. Let’s see whether concentrating on more recent results gives a better predictor of future records. (a) Use the data in Table 2 (page 176) to complete the table of winning pole vault heights shown in the margin. (Note that we are using x=0 to correspond to the year 1972, where this restricted data set begins.) (b) Find the regression line for the data in part ‚(a). (c) Plot the data and the regression line on the same axes. Does the regression line seem to provide a good model for the data? (d) What does the regression line predict as the winning pole vault height for the 2012 Olympics? Compare this predicted value to the actual 2012 winning height of 5.97 m, as described on page 177. Has this new regression line provided a better prediction than the line in Example 2?9)Suppose that Y is normal and we have three explanatory unknowns which are also normal, and we have an independent random sample of 11 members of the population, where for each member, the value of Y as well as the values of the three explanatory unknowns were observed. The data is entered into a computer using linear regression software and the output summary tells us that R-square is 0.79, the linear model coefficient of the first explanatory unknown is 7 with standard error estimate 2.5, the coefficient for the second explanatory unknown is 11 with standard error 2, and the coefficient for the third explanatory unknown is 15 with standard error 4. The regression intercept is reported as 28. The sum of squares in regression (SSR) is reported as 79000 and the sum of squared errors (SSE) is 21000. From this information, what is the adjusted R-square? .8 .7 NONE OF THE OTHERS .6 .58)Suppose that Y is normal and we have three explanatory unknowns which are also normal, and we have an independent random sample of 11 members of the population, where for each member, the value of Y as well as the values of the three explanatory unknowns were observed. The data is entered into a computer using linear regression software and the output summary tells us that R-square is 0.86, the linear model coefficient of the first explanatory unknown is 7 with standard error estimate 2.5, the coefficient for the second explanatory unknown is 11 with standard error 2, and the coefficient for the third explanatory unknown is 15 with standard error 4. The regression intercept is reported as 28. The sum of squares in regression (SSR) is reported as 86000 and the sum of squared errors (SSE) is 14000. From this information, what is MSE/MST? .5000 NONE OF THE OTHERS .2000 .3000 .4000
- 17) Suppose that Y is normal and we have three explanatory unknowns which are also normal, and we have an independent random sample of 41 members of the population, where for each member, the value of Y as well as the values of the three explanatory unknowns were observed. The data is entered into a computer using linear regression software and the output summary tells us that R-square is 0.9, the linear model coefficient of the first explanatory unknown is 7 with standard error estimate 2.5, the coefficient for the second explanatory unknown is 11 with standard error 2, and the coefficient for the third explanatory unknown is 15 with standard error 4. The regression intercept is reported as 28. The sum of squares in regression (SSR) is reported as 90000 and the sum of squared errors (SSE) is 10000. From this information, what is the number of degrees of freedom for the t-distribution used to compute critical values for hypothesis tests and confidence intervals for the individual…Suppose a study wants to predict the market price of a certain species of turtle (Y) based on the following independent variables indicated in the table. Based from the table, what is the equation of the multiple linear regression? (Round off up to two decimal places. Market Price = 0.07 - 0.40*weight + 1.51*length + 1.41*width + 0.80*age Market Price = - 0.40*weight + 1.51*length + 1.41*width + 0.80*age Market Price = 0.07 + 0.40*weight + 1.51*length + 1.41*width + 0.80*age Market Price = 0.07 - 0.40 + weight + 1.51 + length + 1.41 + width + 0.80 + ageIn Australia, 16% of the adult population is nearsighted.17 If three Australians are chosen at random, what is the probability that two are nearsighted and one is not? 2.state each of the five assumptions of the classical regression model (OLS) and give an intuitive explanation of the meaning and need for each of them.
- Years of Work Experience and number of Job Offers of 10 job-seekers were as follows: Work Exp. 4 2 5 3 7 12 2 5 4 9 No. of Offers 7 1 8 4 13 19 3 11 9 15 a. Fit the regression equation of No. of Job Offers on Years of Work Experience. b. What will be the predicted number of offers for an applicant with 6 years of experience? c. Verify the relationship between the number of job offers and years of work experience using at least two relevant methodshe following table shows the annual number of PhD graduates in a country in various fields. NaturalSciences Engineering SocialSciences Education 1990 70 10 60 30 1995 130 40 100 50 2000 330 130 280 140 2005 490 370 460 210 2010 590 550 830 520 2012 690 590 1,000 900 (a)With x = the number of social science doctorates and y = the number of education doctorates, use technology to obtain the regression equation. (Round coefficients to three significant digits.) y(x) = Use technology to obtain the coefficient of correlation r. (Round your answer to three decimal places.) r =Suppose we want to predict job performance of mechanics based on mechanical aptitude test scores and test scores from personality test that measures conscientiousness. (a) Determine the regression equation. (b) Determine the SSE. Y X1 X2 1 40 25 2 45 20 1 38 30 3 50 30 2 48 28 3 55 30 3 53 34 4 55 36 4 58 32 3 40 34 5 55 38 3 48 28 3 45 30 2 55 36 4 60 34 5 60 38 5 60 42 5 65 38 4 50 34 3 58 38 Where Y is the Performance of the mechanics, X1 is the mechanical aptitude test and X2 is the personality test score that measure conscientiousness.
- In a multiple linear regression model with 3 predictor variables, what is the t-statistic for the hypothesis test of the null hypothesis that the coefficient of the second predictor variable is equal to 0, if the estimated coefficient is 0.5, the standard error of the estimate is 0.1, and the degrees of freedom is 15?The following table shows the annual number of PhD graduates in a country in various fields. NaturalSciences Engineering SocialSciences Education 1990 70 10 70 30 1995 130 40 110 40 2000 330 130 280 120 2005 490 370 460 210 2010 590 550 830 520 2012 690 590 1,000 900 (a) With x = the number of social science doctorates and y = the number of education doctorates, use technology to obtain the regression equation. (Round coefficients to three significant digits.) y(x) = (b) Use technology to obtain the coefficient of correlation r. (Round your answer to three decimal places.) r =Suppose that a least squares regression line equation is ˆy = 1.65 − 2.20x and the actual y value corresponding to x = 10 is −19, what is the residual value corresponding to y = −19?