A researcher is studying two types of medication that both treat hives. 24 out of the random sample of 224 adults given medication A still had hives 30 minutes after taking the medication. 16 out of another random sample of 287 adults given medication B still had hives 30 minutes after taking the medication. Test to see if the proportion of people who still had hives after medicine A is less than the proportion of people who still had hives after medicine B. Use a 0.10 level of significance. The correct hypotheses are: Ho:PA < PB НА: РА > рв(claim) Ho :PA 2 PB HA:PA НА:РА < рВ(claim) • Ho:PA = PB HA:PA + PB(claim) Since the level of significance is 0.10 the critical value is -1.282 The test statistic is: (round to 3 places) The p-value is: (round to 3 places)
A researcher is studying two types of medication that both treat hives. 24 out of the random sample of 224 adults given medication A still had hives 30 minutes after taking the medication. 16 out of another random sample of 287 adults given medication B still had hives 30 minutes after taking the medication. Test to see if the proportion of people who still had hives after medicine A is less than the proportion of people who still had hives after medicine B. Use a 0.10 level of significance. The correct hypotheses are: Ho:PA < PB НА: РА > рв(claim) Ho :PA 2 PB HA:PA НА:РА < рВ(claim) • Ho:PA = PB HA:PA + PB(claim) Since the level of significance is 0.10 the critical value is -1.282 The test statistic is: (round to 3 places) The p-value is: (round to 3 places)

Glencoe Algebra 1, Student Edition, 9780079039897, 0079039898, 2018
18th Edition
ISBN:9780079039897
Author:Carter
Publisher:Carter
Chapter10: Statistics
Section10.6: Summarizing Categorical Data
Problem 10CYU

Related questions

Topic Video
Question
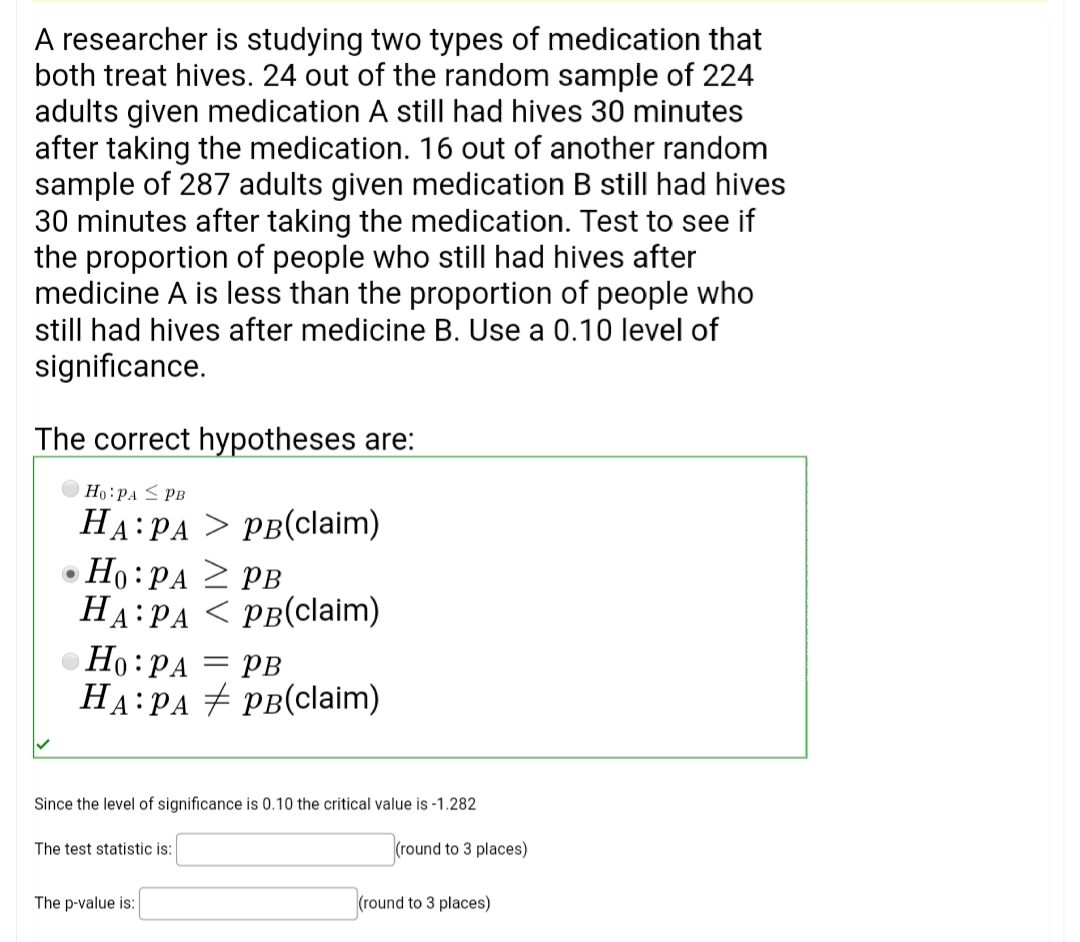
Transcribed Image Text:A researcher is studying two types of medication that
both treat hives. 24 out of the random sample of 224
adults given medication A still had hives 30 minutes
after taking the medication. 16 out of another random
sample of 287 adults given medication B still had hives
30 minutes after taking the medication. Test to see if
the proportion of people who still had hives after
medicine A is less than the proportion of people who
still had hives after medicine B. Use a 0.10 level of
significance.
The correct hypotheses are:
Ho:PA < PB
НА: РА > рв(claim)
Ho :PA 2 PB
HA:PA
НА:РА < рВ(claim)
• Ho:PA = PB
HA:PA + PB(claim)
Since the level of significance is 0.10 the critical value is -1.282
The test statistic is:
(round to 3 places)
The p-value is:
(round to 3 places)
Expert Solution
Step 1
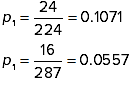
Find the probability that people given medication A and B still have hives using the formula:
Let us take the hypothesis:

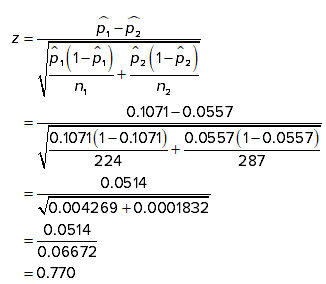
The test statistic for the hypothesis testing is obtained using the formula:
The tabulated value is given by

Since calculated value of z-statistic < tabulated value, we accept null hypothesis (at 5% level of significance) and conclude that 

Trending now
This is a popular solution!

Step by step
Solved in 2 steps with 6 images

Knowledge Booster


Learn more about
Need a deep-dive on the concept behind this application? Look no further. Learn more about this topic, statistics and related others by exploring similar questions and additional content below.Recommended textbooks for you
Glencoe Algebra 1, Student Edition, 9780079039897…
Algebra
ISBN:
9780079039897
Author:
Carter
Publisher:
McGraw Hill

Holt Mcdougal Larson Pre-algebra: Student Edition…
Algebra
ISBN:
9780547587776
Author:
HOLT MCDOUGAL
Publisher:
HOLT MCDOUGAL

Algebra & Trigonometry with Analytic Geometry
Algebra
ISBN:
9781133382119
Author:
Swokowski
Publisher:
Cengage
Glencoe Algebra 1, Student Edition, 9780079039897…
Algebra
ISBN:
9780079039897
Author:
Carter
Publisher:
McGraw Hill
Holt Mcdougal Larson Pre-algebra: Student Edition…
Algebra
ISBN:
9780547587776
Author:
HOLT MCDOUGAL
Publisher:
HOLT MCDOUGAL
Algebra & Trigonometry with Analytic Geometry
Algebra
ISBN:
9781133382119
Author:
Swokowski
Publisher:
Cengage

College Algebra
Algebra
ISBN:
9781305115545
Author:
James Stewart, Lothar Redlin, Saleem Watson
Publisher:
Cengage Learning