A researcher wishes to estimate the average blood alcohol concentration (BAC) for drivers involved in fatal accidents who are fouhd to Have positve BAL records from 51 such drivers in 2009 and determines the sample mean BAC to be 0.16 g/dL with domly standard deviation of 0.080 g/dL. Complete parts (a) through (d) below. B. The sample size is likely less than 5% of the population. O C. The sample size is likely less than 10% of the population. O D. The sample size is likely greater than 5% of the population. (c) Determine and interpret a 90% confidence interval for the mean BAC in fatal crashes in which the driver had a positive BAC. Select the correct choice below and fill in the answer boxes to complete your choice. (Use ascending order. Round to three decimal places as needed.) O A. The researcher is % confident that the population mean BAC is between and for drivers involved in fatal accidents who have a positive BAC value. O B. There is a for drivers involved in fatal accidents who have a positive BAC value. % probability that the population mean BAC is between and O C. The researcher is confident that the population mean BAC is not between and for drivers involved in fatal accidents who have a positive BAC value.
A researcher wishes to estimate the average blood alcohol concentration (BAC) for drivers involved in fatal accidents who are fouhd to Have positve BAL records from 51 such drivers in 2009 and determines the sample mean BAC to be 0.16 g/dL with domly standard deviation of 0.080 g/dL. Complete parts (a) through (d) below. B. The sample size is likely less than 5% of the population. O C. The sample size is likely less than 10% of the population. O D. The sample size is likely greater than 5% of the population. (c) Determine and interpret a 90% confidence interval for the mean BAC in fatal crashes in which the driver had a positive BAC. Select the correct choice below and fill in the answer boxes to complete your choice. (Use ascending order. Round to three decimal places as needed.) O A. The researcher is % confident that the population mean BAC is between and for drivers involved in fatal accidents who have a positive BAC value. O B. There is a for drivers involved in fatal accidents who have a positive BAC value. % probability that the population mean BAC is between and O C. The researcher is confident that the population mean BAC is not between and for drivers involved in fatal accidents who have a positive BAC value.

MATLAB: An Introduction with Applications
6th Edition
ISBN:9781119256830
Author:Amos Gilat
Publisher:Amos Gilat
Chapter1: Starting With Matlab
Section: Chapter Questions
Problem 1P

Related questions

Question
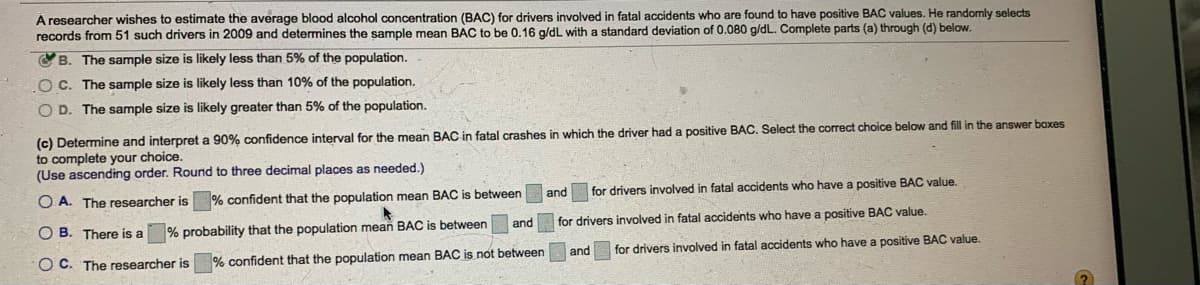
Transcribed Image Text:Á researcher wishes to estimate the average blood alcohol concentration (BAC) for drivers involved in fatal accidents who are found to have positive BAC values. He randomly selects
records from 51 such drivers in 2009 and determines the sample mean BAC to be 0.16 a/dL with a standard deviation of 0.080 g/dL. Complete parts (a) through (d) below.
O B. The sample size is likely less than 5% of the population.
OC. The sample size is likely less than 10% of the population.
O D. The sample size is likely greater than 5% of the population.
(c) Determine and interpret a 90% confidence interval for the mean BAC in fatal crashes in which the driver had a positive BAC. Select the correct choice below and fill in the answer boxes
to complete your choice.
(Use ascending order. Round to three decimal places as needed.)
O A. The researcher is
% confident that the population mean BAC is between
and
for drivers involved in fatal accidents who have a positive BAC value.
O B. There is a
% probability that the population mean BAC is between
and for drivers involved in fatal accidents who have a positive BAC value.
O C. The researcher is
% confident that the population mean BAC is not between
and
for drivers involved in fatal accidents who have a positive BAC value.

Transcribed Image Text:(c) Determine and interpret a 90% confidence interval for the mean BAC in fatal crashes in which the driver had a positive BAC. Select the correct choice below and fill in the answer boxes
to complete your choice.
(Use ascending order. Round to three decimal places as needed.)
O A. The researcher is % confident that the population mean BAC is between
and
for drivers involved in fatal accidents who have a positive BAC value.
O B. There is a
% probability that the population mean BAC is between
for drivers involved in fatal accidents who have a positive BAC value.
and
O C. The researcher is
% confident that the population mean BAC is not between
for drivers involved in fatal accidents who have a positive BAC value.
and
Expert Solution
This question has been solved!
Explore an expertly crafted, step-by-step solution for a thorough understanding of key concepts.

This is a popular solution!

Trending now
This is a popular solution!

Step by step
Solved in 2 steps

Knowledge Booster


Learn more about
Need a deep-dive on the concept behind this application? Look no further. Learn more about this topic, statistics and related others by exploring similar questions and additional content below.Recommended textbooks for you
MATLAB: An Introduction with Applications
Statistics
ISBN:
9781119256830
Author:
Amos Gilat
Publisher:
John Wiley & Sons Inc

Probability and Statistics for Engineering and th…
Statistics
ISBN:
9781305251809
Author:
Jay L. Devore
Publisher:
Cengage Learning

Statistics for The Behavioral Sciences (MindTap C…
Statistics
ISBN:
9781305504912
Author:
Frederick J Gravetter, Larry B. Wallnau
Publisher:
Cengage Learning
MATLAB: An Introduction with Applications
Statistics
ISBN:
9781119256830
Author:
Amos Gilat
Publisher:
John Wiley & Sons Inc
Probability and Statistics for Engineering and th…
Statistics
ISBN:
9781305251809
Author:
Jay L. Devore
Publisher:
Cengage Learning
Statistics for The Behavioral Sciences (MindTap C…
Statistics
ISBN:
9781305504912
Author:
Frederick J Gravetter, Larry B. Wallnau
Publisher:
Cengage Learning

Elementary Statistics: Picturing the World (7th E…
Statistics
ISBN:
9780134683416
Author:
Ron Larson, Betsy Farber
Publisher:
PEARSON

The Basic Practice of Statistics
Statistics
ISBN:
9781319042578
Author:
David S. Moore, William I. Notz, Michael A. Fligner
Publisher:
W. H. Freeman

Introduction to the Practice of Statistics
Statistics
ISBN:
9781319013387
Author:
David S. Moore, George P. McCabe, Bruce A. Craig
Publisher:
W. H. Freeman