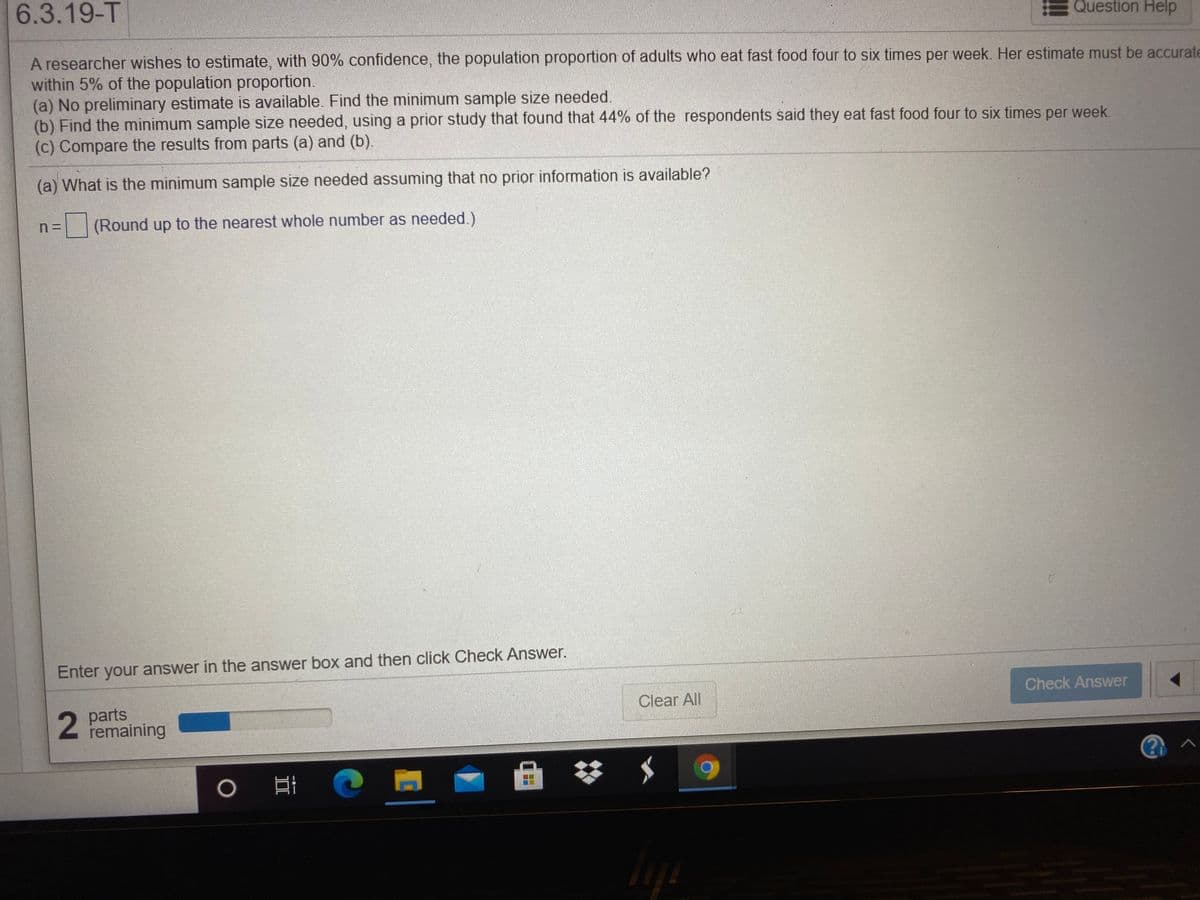
A researcher wishes to estimate, with 90% confidence, the population proportion of adults who eat fast food four to six times per week. Her estimate must be accurate within 5% of the population proportion. (a) No preliminary estimate is available. Find the minimum sample size needed. (b) Find the minimum sample size needed, using a prior study that found that 44% of the respondents said they eat fast food four to six times per week. (c) Compare the results from parts (a) and (b). (a) What is the minimum sample size needed assuming that no prior information is available? = (Round up to the nearest whole number as needed.)
Q: Use the given data to find teh minimum sample size required to estimate the population proportion.…
A: Here we will Use the given data to find the minimum sample size required to estimate the population…
Q: What is the minimal sample size needed for a 99% congidence interval to have a maximal margin of…
A: Given data: congidence interval = 99% maximal margin of error = 0.06 To find: Sample size
Q: A researcher wishes to estimate, with 90% confidence, the population proportion of adults who eat…
A:
Q: A pollster wishes to estimate, with 99% confidence, the proportion of people who believe that recent…
A: Given data, E=2%=0.02 z-value at 99% confidence is Zc=2.576
Q: If the distribution of a population is not Normal, which condition is necessary to find…
A: To find: probabilities within the sampling distribution by method of Normal approximation.
Q: Suppose x has a mound-shaped distribution with σ =4. Find the minimal sample size required so that…
A: Givenstandard deviation(σ)=4Margin of error(E)=0.5confidence interval=90%
Q: A researcher wishes to estimate, with 90% confidence, the population proportion of adults who eat…
A: Given Margin of error=E=0.01 At 90℅ confidence interval
Q: A researcher wishes to estimate, with 95% confidence, the population proportion of adults who eat…
A: Given data, E=5%=0.05 z-value at 95% confidence is Zc=1.96
Q: A researcher wishes to estimate, with 90% confidence, the population proportion of adults who think…
A:
Q: A researcher wishes to estimate, with 99% confidence, the population proportion of adults who eat…
A: Proportion is almost similar to the concept of probability. Proportion is a fraction of population…
Q: What is the minimal sample size needed for a 95% confidence interval to have a maximal margin of…
A: The formula for the sample size needed to estimate a population proportion is
Q: A researcher wishes to estimate, with 95%confidence, the population proportion of adults who eat…
A: It is provided that the estimate must be accurate within 3%. So, the margin of error (E) is 3%.If…
Q: A researcher wishes to estimate, with 99% confidence, the population proportion of adults who…
A:
Q: A researcher wishes to estimate, with 95% confidence, the population proportion of adults who think…
A: The sample size is calculated using the margin error, critical value and proportion using the…
Q: eat fast food four to six times per week. Her estimate must be accurate within 5% of the population…
A: Given Data : Margin of error, ME = 0.05 Significance level, α =1- 0.95 =…
Q: A researcher wishes to estimate, with 95% confidence, the population proportion of adults who eat…
A: The confidence level is 95% and margin of error is 0.02.
Q: A researcher wishes to estimate, with 95% confidence, the population proportion of adults who eat…
A: Here we need to find the sample size associated with both the cases.
Q: A researcher wishes to estimate, with 95% confidence, the population proportion of adults who eat…
A: Solution step 1 given data is level of confidence = CI = 0.95 (95%) margin of voh= ∈= o. 05…
Q: A researcher wishes to estimate, with 90% confidence, the population proportion of adults who eat…
A: Given information: Significance level = α = 1 - 0.90 = 0.10…
Q: A researcher wishes to estimate, with 90%confidence, the population proportion of adults who eat…
A: Let p be the true proportion of adults who eat fast food four to six times per week. The margin of…
Q: A researcher wishes to estimate, with 90% confidence, the population proportion of adults who eat…
A: GivenMargin of error(E)=0.05confidence level = 90%
Q: A researcher wishes to estimate, with 99% confidence, the population proportion of adults who…
A: From the provided information, Margin of error (E) = 2% or 0.02 Confidence level = 99%
Q: A researcher wishes to estimate, with 95% confidence, the population proportion of adults who eat…
A: a)
Q: A researcher wishes to estimate, with 99% confidence, the population proportion of adults who think…
A: Sample size :
Q: Find the critical values x = x_o/2 and xR = x2 12 that correspond to 90% degree of confidence and…
A:
Q: Use the given data to find the minimum sample size required to estimate the population proportion.…
A: The confidence level is 95% Therefore, α = 0.05 and α/2=0.025. The margin of error is 0.01 Here, p=…
Q: A researcher wishes to estimate, with 90% confidence, the population proportion of adults who eat…
A: Given that Margin of error =E =4%=0.04 90% confidence.
Q: d. What is the minimal sample size needed for a 95% confidence interval to have a maximal margin of…
A: If both the expected number of success and expected number of failures are greater or equal to 10,…
Q: A researcher wishes to estimate, with 95% confidence, the population proportion of adults who eat…
A: (a) Given that, Critical value: Using the z-table, the critical value at 95% confidence level is…
Q: A researcher wishes to estimate, with 95% confidence, the population proportion of adults who eat…
A:
Q: A researcher wishes to estimate, with 90% confidence, the population proportion of adults who eat…
A: compute sample size ( n ) = n=(Z/E)^2*p*(1-p)
Q: A researcher wishes to estimate, with 90% confidence, the population proportion of adults who eat…
A: From the provided information, Confidence level = 90% Margin of error = 0.02
Q: Considering a 3-sigma p chart with center line at 0.1, what minimum sample size is required to have…
A: For a given standard center line in 3-sigma p chart, LCL=p-3p1-pn where, LCL: Lower control limit.…
Q: A researcher wishes to estimate, with 90% confidence, the population proportion of adults who…
A: (a) Margin of error=0.05(5%) The critical value of Z at 0.10 level of significance is 1.645. Here…
Q: In knee surgery, the doctors considered arthroscopic meniscal repair with an absorbable screw.…
A: Solution To estimate the proportion we will use conservation proportion estimate.
Q: A. Determine the sample size required to estimate a population proportion to within 0.04 with 94.3%…
A: It is given that margin of error (E) is 0.04 and the confidence level is 0.943.
Q: According to the Central Limit Theorem (CLT), as sample size increases, the confidence intervals:…
A: The sample size is inversely proportion to standard error. If the sample size increases then the…
Q: A researcher wishes to estimate, with 90% confidence, the population proportion of adults who…
A:
Q: A. Determine the sample size required to estimate a population proportion to within 0.04 with 97.8%…
A: Find z-critical value:…
Q: A researcher wishes to estimate, with 99% confidence, the population proportion of adults who eat…
A: Confidence level: A confidence level is the the proportion of all possible samples that are expected…
Q: A researcher wishes to estimate, with 95% confidence, the population proportion of adults who…
A: a.The estimate value must be accurate within 4%. The margin of error is E = 0.04.The confidence…
Q: A researcher wishes to estimate, with 99% confidence, the population proportion of adults who eat…
A: a.The estimate value must be accurate within 33% of the population proportion.The margin of error is…
Q: A researcher wishes to estimate, with 95% confidence, the population proportion of adults who eat…
A:
Q: A researcher wishes to estimate, with 90% confidence, the population proportion of adults who eat…
A: Find z-critical value: For the two-tail test, Area on each tail. Area to the left of the normal…
Q: A researcher wishes to estimate, with 99% confidence, the population proportion of adults who eat…
A: Given,margin of error(E)=0.05α=1-0.99=0.01α2=0.005Z0.005=2.58 (from Z-table)
Q: A researcher wishes to estimate, with 95% confidence, the population proportion of adults who eat…
A: a) The following information is provided that is required to compute the minimum sample size:…
Q: A researcher wishes to estimate, with 95% confidence, the population proportion of adults who eat…
A: Given information: A researcher wishes to estimate, with 95% confidence interval. The population…
Q: A researcher wishes to estimate, with 95% confidence, the population proportion of adults who eat…
A:
Q: A researcher wishes to estimate, with 95% confidence, the population proportion of adults who…
A: (a)compute sample size ( n ) = n=(Z/E)^2*p*(1-p) Z a/2 at 0.05 level of significance is = 1.96sample…
Q: A researcher wishes to estimate, with 90% confidence, the population proportion of adults who…
A:
Trending now
This is a popular solution!
Step by step
Solved in 4 steps with 22 images
- A student decides to spin a dime and determine the proportion of times it lands on heads. The student spins the dime 25 times and records that it lands on heads 17 times. Let p = the true proportion of times the dime would land on heads when spun. Under the assumption that the true proportion is 0.5, 100 simulated proportions for samples of size 25 is shown in the dotplot. Using the dotplot, is there evidence that the proportion of times a spun dime lands on heads is greater than 0.5? A) Yes, a proportion of 0.68 proves that the true proportion of heads is greater than 0.5. B) Yes, a proportion of 0.68 only occurred once out of 100 simulated proportions; therefore, there is sufficient evidence that the true proportion of heads is greater than 0.5. C) No, a proportion of 0.68 is only 0.18 more than 0.5; therefore, there is insufficient evidence that the true proportion of heads is greater than 0.5. D) No, a proportion of 0.68 or more occurred 7 times out of 100 simulated…34b)Consider using a homoscedastic t-test to determine whether two populations have the same mean. If the sample sizes are both 7 and the sample variances are 5, what is the minimum difference between the sample means we would need to observe to decide that the population means are significantly different at an overall p<0.05 level?Q.6.1 A national publishing house claims that 37% of all weekly magazine readers in South Africa read their publication. Test this claim at the 1% significance level, if a survey found that 140 out of a random sample of 400 magazine readers said that they read the relevant publication. Q.6.2 The CEO of a large financial institution claims that, on average, their clients invest more than R45 000 per year in a particular portfolio. Test this claim at the 5% significance level if it was found that a sample of 21 clients invested an average of R44 500 in the portfolio over the last year, with a standard deviation of R5 500.
- 1.3 The Minister of Labour would like to know the proportion of employed people who qualify to receive COVID-19 Relief Fund in Mamelodi at a 90% confidence with an estimation error of ±0.98%. A preliminary survey of 100 conducted in Mamelodi revealed that 65% qualify for COVID-19 Relief Fund. What sample size would be required to estimate the population proportion of those who qualify for COVID-19 Relief Fund in Mamelodi?In a survey of 1000 adult Americans, 45.9% indicated that they were somewhat interested or very interested in having web access in their cars. Suppose that the marketing manager of a car manufacturer claims that the 45.9% is based only on a sample and that 45.9% is close to half, so there is no reason to believe that the proportion of all adult Americans who want car web access is less than 0.50. Is the marketing manager correct in his claim? Provide statistical evidence to support your answer. For purposes of this exercise, assume that the sample can be considered as representative of adult Americans. Test the relevant hypotheses using ? = 0.05. a. Find the test statistic and P-value. (Round your test statistic to two decimal places and your P-value to four decimal places.) z= P-value= b. State the conclusion in the context of the problem. a. Fail to reject H0. We have convincing evidence that the proportion of all adult Americans who want car web access is less than…An engineer is comparing voltages for two types of batteries (K and Q) using a sample of 7070 type K batteries and a sample of 8585 type Q batteries. The type K batteries have a mean voltage of 8.848.84, and the population standard deviation is known to be 0.3030.303. The type Q batteries have a mean voltage of 9.059.05, and the population standard deviation is known to be 0.3670.367. Conduct a hypothesis test for the conjecture that the mean voltage for these two types of batteries is different. Let μ1μ1 be the true mean voltage for type K batteries and μ2μ2 be the true mean voltage for type Q batteries. Use a 0.010.01 level of significance. Step 3 of 4 : Determine the decision rule for rejecting the null hypothesis H0H0. Round the numerical portion of your answer to three decimal places.
- At any age, about 20% of American adults participate in physical conditioning activities at least twice a week. However, these activities change as people get older, and occasionally participants cease to be older as they age. In a local survey of n = 100 adults over 40 years of age, a total of 15 people indicated that they participated in these activities at least twice a week. Does this data indicate that the percentage of participation for adults over 40 years of age is considerably less than the 20% figure? Find the p-value and use it to draw the appropriate conclusions.A recent poll found that 664 out of 1026 randomly selected people in a particular country felt that colleges and universities with big sports programs placed too much emphasis on athletics over academics. Assuming the conditions for the CLT are met, use the accompanying Minitab output to complete parts a and b below. N Event Sample p 95% CI for p 1026 664 0.647173 (0.617934, 0.676413) Question content area bottom b. Suppose a sports blogger wrote an article claiming that a majority of adults from this country believe that colleges and universities with big sports programs place too much emphasis on athletics over academics. Does this confidence interval support the blogger's claim? Explain your reasoning. A. No, it is not a plausible claim because the confidence interval contains 50%. B. No, it is not a plausible claim because the confidence interval does not contain only values above 50%. C. Yes, it is a…Also, using α = .05, run a two-tail t-test for one sample to test Ho: µ=283 for the 2009 scores. Report the t-obt, df, and p-values. Would you reject the null hypothesis that the 2009 scores come from a population with average 283? If this is the case, does it come from a population from larger or smaller average?
- On average, a sample of n = 36 scores from a normal population with σ= 10 will provide a better estimate of the population mean than a researcher would get with a sample of n = 9 scores from a normal population with σ= 10.(a) What is the minimal sample size needed for a 95% confidence interval to have a maximal margin of error of 0.2 if a preliminary estimate for p is 0.38? Recall that the minimal sample size n for a given maximal margin of error when a preliminary estimate for p is known can be found using the formula n = p(1 − p) zc E 2 , where E is the maximal margin of error.We are interested in the minimal sample size for a 95% confidence interval with a maximal margin of error of 0.2. The table below lists critical values for confidence intervals at different levels of confidence. Confidence Interval Critical Values zc Level of Confidence c Critical Value zc 0.70, or 70% 1.04 0.75, or 75% 1.15 0.80, or 80% 1.28 0.85, or 85% 1.44 0.90, or 90% 1.645 0.95, or 95% 1.96 0.98, or 98% 2.33 0.99, or 99% 2.58 According to this table, for a 95% confidence level, z0.95 = 1.96. We want the confidence interval to have a maximal margin of error of 0.2 and…Will improving customer service result in higher stock prices for the companies providing the better service? "When a company's satisfaction score has improved over the prior year's results and is above the national average (75.7), studies show its shares have a good chance of outperforming the broad stock market in the long run." The following satisfaction scores of three companies for the fourth quarters of two previous years were obtained from the American Customer Satisfaction Index. Assume that the scores are based on a poll of 61 customers from each company. Because the polling has been done for several years, the standard deviation can be assumed to equal 7 points in each case.