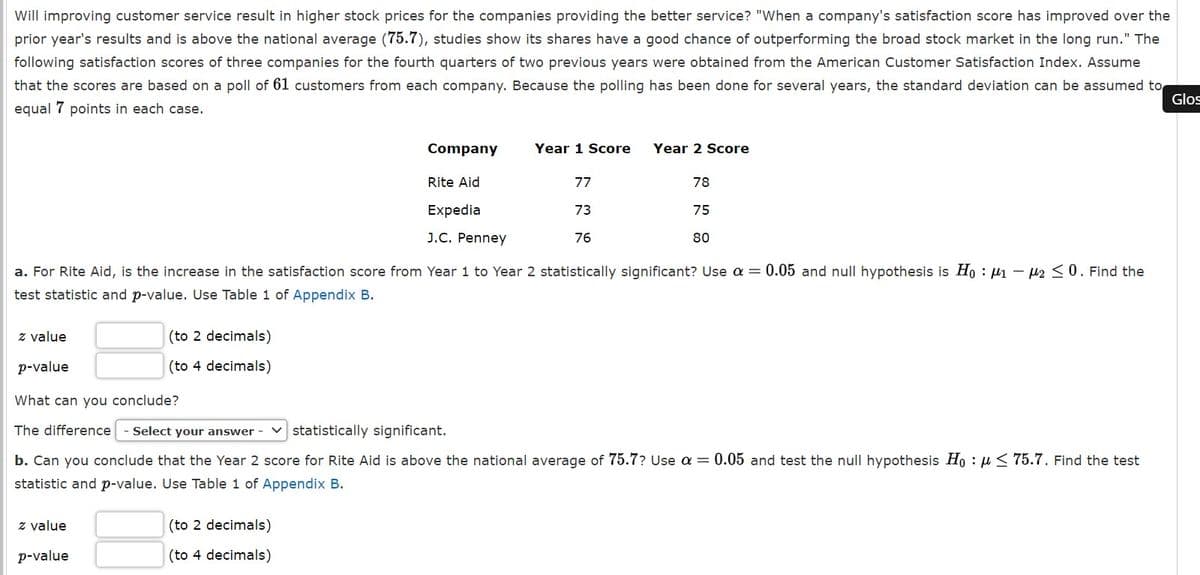
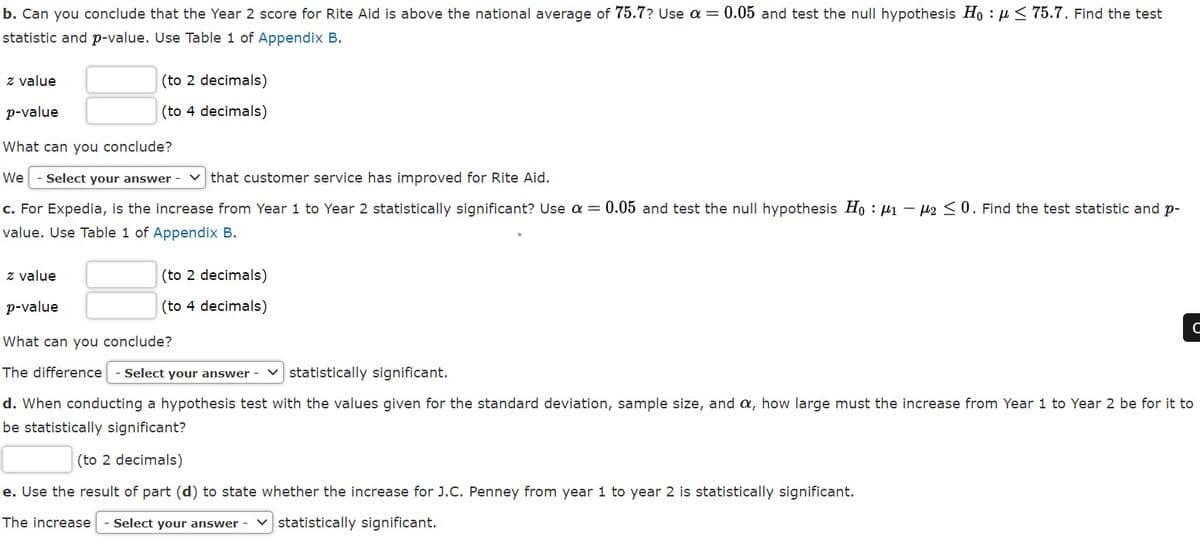
Will improving customer service result in higher stock prices for the companies providing the better service? "When a company's satisfaction score has improved over the prior year's results and is above the national average (75.7), studies show its shares have a good chance of outperforming the broad stock market in the long run." The following satisfaction scores of three companies for the fourth quarters of two previous years were obtained from the American Customer Satisfaction Index. Assume that the scores are based on a poll of 61 customers from each company. Because the polling has been done for several years, the standard deviation can be assumed to equal 7 points in each case.


Will improving customer service result in higher stock prices for the companies providing the better service? "When a company's satisfaction score has improved over the prior year's results and is above the national average (75.7), studies show its shares have a good chance of outperforming the broad stock market in the long run." The following satisfaction scores of three companies for the fourth quarters of two previous years were obtained from the American Customer Satisfaction Index. Assume that the scores are based on a poll of 61 customers from each company. Because the polling has been done for several years, the standard deviation can be assumed to equal 7 points in each case.


Trending now
This is a popular solution!

Step by step
Solved in 6 steps with 10 images

