A researcher with the Department of Education followed a cohort of students who graduated from high school in a certain year, monitoring the progress the students made toward completing a bachelor's degree. One aspect of his research was to determine whether students who first attended community college took longer to attain a bachelor's degree than those who immediately attended and remained at a 4-year institution. The data in the table attached below summarize the results of his study. Complete parts a) through e) below. Click here to view the sample data, Click here to view Student's t-distribution table. a) What is the response variable in this study? What is the explanatory variable? O A. The response variable is the time to graduate. The explanatory variable is the use of community college or not. Sample data O B. The response variable is the time to graduate. The explanatory variable is the number of students. OC. The response variable is the use of community college or not. The explanatory variable is the time to graduate. Community College Transfer 257 5.46 No Transfer O D. The response variable is the number of students. The explanatory variable is the time to graduate. 1136 4.50 Sample mean time to graduate, in years Sample standard deviation time to 1.145 1.011 graduate, in years
A researcher with the Department of Education followed a cohort of students who graduated from high school in a certain year, monitoring the progress the students made toward completing a bachelor's degree. One aspect of his research was to determine whether students who first attended community college took longer to attain a bachelor's degree than those who immediately attended and remained at a 4-year institution. The data in the table attached below summarize the results of his study. Complete parts a) through e) below. Click here to view the sample data, Click here to view Student's t-distribution table. a) What is the response variable in this study? What is the explanatory variable? O A. The response variable is the time to graduate. The explanatory variable is the use of community college or not. Sample data O B. The response variable is the time to graduate. The explanatory variable is the number of students. OC. The response variable is the use of community college or not. The explanatory variable is the time to graduate. Community College Transfer 257 5.46 No Transfer O D. The response variable is the number of students. The explanatory variable is the time to graduate. 1136 4.50 Sample mean time to graduate, in years Sample standard deviation time to 1.145 1.011 graduate, in years

Linear Algebra: A Modern Introduction
4th Edition
ISBN:9781285463247
Author:David Poole
Publisher:David Poole
Chapter7: Distance And Approximation
Section7.3: Least Squares Approximation
Problem 31EQ

Related questions
Question
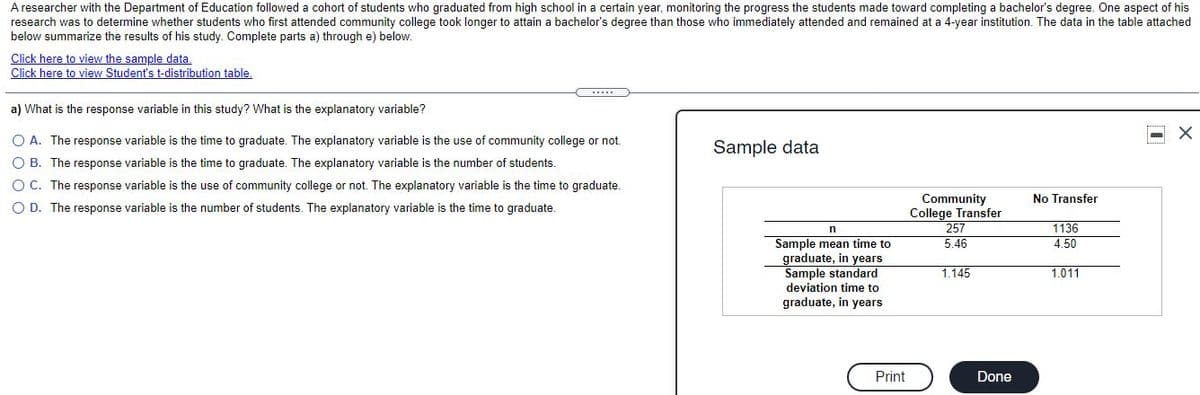
Transcribed Image Text:A researcher with the Department of Education followed a cohort of students who graduated from high school in a certain year, monitoring the progress the students made toward completing a bachelor's degree. One aspect of his
research was to determine whether students who first attended community college took longer to attain a bachelor's degree than those who immediately attended and remained at a 4-year institution. The data in the table attached
below summarize the results of his study. Complete parts a) through e) below.
Click here to view the sample data.
Click here to view Student's t-distribution table.
a) What is the response variable in this study? What is the explanatory variable?
O A. The response variable is the time to graduate. The explanatory variable is the use of community college or not.
Sample data
O B. The response variable is the time to graduate. The explanatory variable is the number of students.
O C. The response variable is the use of community college or not. The explanatory variable is the time to graduate.
Community
College Transfer
No Transfer
O D. The response variable is the number of students. The explanatory variable is the time to graduate.
257
1136
4.50
Sample mean time to
graduate, in years
Sample standard
5.46
1.145
1.011
deviation time to
graduate, in years
Print
Done
Expert Solution
This question has been solved!
Explore an expertly crafted, step-by-step solution for a thorough understanding of key concepts.

This is a popular solution!

Trending now
This is a popular solution!

Step by step
Solved in 2 steps

Recommended textbooks for you
Linear Algebra: A Modern Introduction
Algebra
ISBN:
9781285463247
Author:
David Poole
Publisher:
Cengage Learning

Algebra & Trigonometry with Analytic Geometry
Algebra
ISBN:
9781133382119
Author:
Swokowski
Publisher:
Cengage

Glencoe Algebra 1, Student Edition, 9780079039897…
Algebra
ISBN:
9780079039897
Author:
Carter
Publisher:
McGraw Hill
Linear Algebra: A Modern Introduction
Algebra
ISBN:
9781285463247
Author:
David Poole
Publisher:
Cengage Learning
Algebra & Trigonometry with Analytic Geometry
Algebra
ISBN:
9781133382119
Author:
Swokowski
Publisher:
Cengage
Glencoe Algebra 1, Student Edition, 9780079039897…
Algebra
ISBN:
9780079039897
Author:
Carter
Publisher:
McGraw Hill

Big Ideas Math A Bridge To Success Algebra 1: Stu…
Algebra
ISBN:
9781680331141
Author:
HOUGHTON MIFFLIN HARCOURT
Publisher:
Houghton Mifflin Harcourt