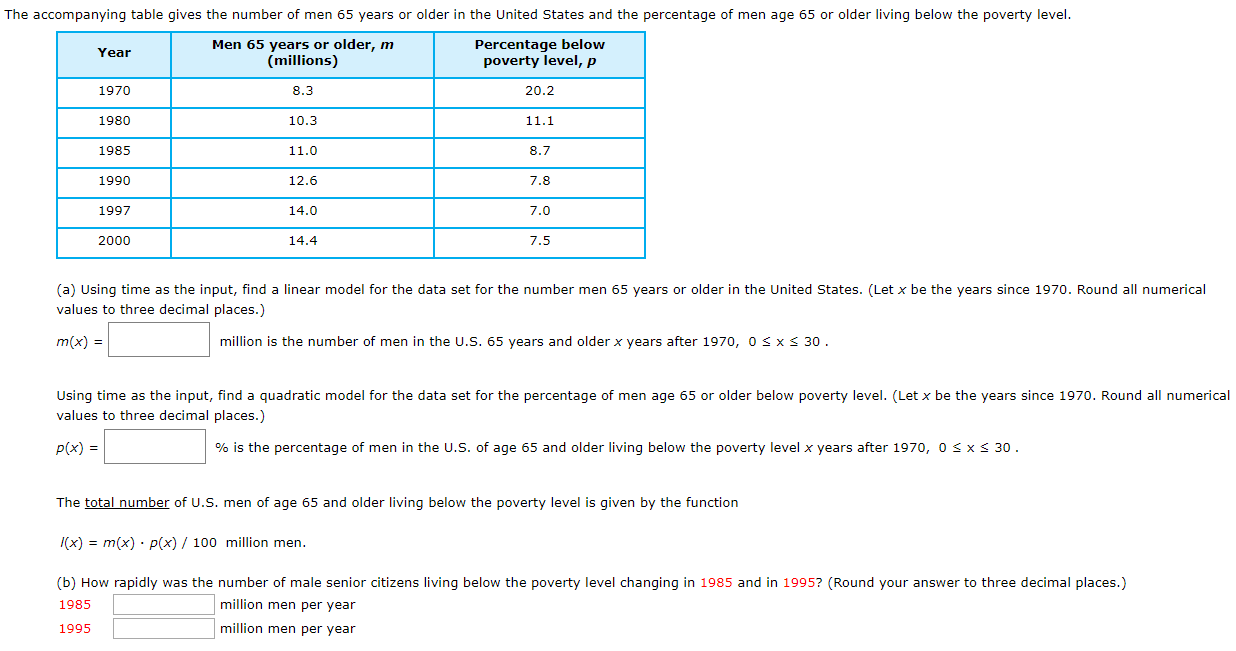
The accompanying table gives the number of men 65 years or older in the United States and the percentage of men age 65 or older living below the poverty level. Percentage below poverty level, p Men 65 years or older, m (millions) Year 1970 8.3 20.2 1980 10.3 11.1 1985 11.0 8.7 1990 12.6 7.8 1997 14.0 7,0 2000 14.4 7.5 (a) Using time as the input, find a linear model for the data set for the number men 65 years or older in the United States. (Let x be the years since 1970. Round all numerical values to three decimal places.) million is the number of men in the U.S. 65 years and older x years after 1970, 0 S xs 30 m(x) Using time as the input, find a quadratic model for the data set for the percentage of men age 65 or older below poverty level. (Let x be the years since 1970. Round all numerical values to three decimal places.) % is the percentage of men in the U.S. of age 65 and older living below the poverty level x years after 1970, 0 s x P(x)= 30 The total number of U.S. men of age 65 and older living below the poverty level is given by the function (x) m(x) p(x) 100 million men (b) How rapidly was the number of male senior citizens living below the poverty level changing in 1985 and in 1995? (Round your answer to three decimal places.) million men per year 1985 million men per year 1995
The accompanying table gives the number of men 65 years or older in the United States and the percentage of men age 65 or older living below the poverty level. Percentage below poverty level, p Men 65 years or older, m (millions) Year 1970 8.3 20.2 1980 10.3 11.1 1985 11.0 8.7 1990 12.6 7.8 1997 14.0 7,0 2000 14.4 7.5 (a) Using time as the input, find a linear model for the data set for the number men 65 years or older in the United States. (Let x be the years since 1970. Round all numerical values to three decimal places.) million is the number of men in the U.S. 65 years and older x years after 1970, 0 S xs 30 m(x) Using time as the input, find a quadratic model for the data set for the percentage of men age 65 or older below poverty level. (Let x be the years since 1970. Round all numerical values to three decimal places.) % is the percentage of men in the U.S. of age 65 and older living below the poverty level x years after 1970, 0 s x P(x)= 30 The total number of U.S. men of age 65 and older living below the poverty level is given by the function (x) m(x) p(x) 100 million men (b) How rapidly was the number of male senior citizens living below the poverty level changing in 1985 and in 1995? (Round your answer to three decimal places.) million men per year 1985 million men per year 1995

Big Ideas Math A Bridge To Success Algebra 1: Student Edition 2015
1st Edition
ISBN:9781680331141
Author:HOUGHTON MIFFLIN HARCOURT
Publisher:HOUGHTON MIFFLIN HARCOURT
Chapter11: Data Analysis And Displays
Section: Chapter Questions
Problem 10CT

Related questions
Question
Transcribed Image Text:The accompanying table gives the number of men 65 years or older in the United States and the percentage of men age 65 or older living below the poverty level.
Percentage below
poverty level, p
Men 65 years or older, m
(millions)
Year
1970
8.3
20.2
1980
10.3
11.1
1985
11.0
8.7
1990
12.6
7.8
1997
14.0
7,0
2000
14.4
7.5
(a) Using time as the input, find a linear model for the data set for the number men 65 years or older in the United States. (Let x be the years since 1970. Round all numerical
values to three decimal places.)
million is the number of men in the U.S. 65 years and older x years after 1970, 0 S xs 30
m(x)
Using time as the input, find a quadratic model for the data set for the percentage of men age 65 or older below poverty level. (Let x be the years since 1970. Round all numerical
values to three decimal places.)
% is the percentage of men in the U.S. of age 65 and older living below the poverty level x years after 1970, 0 s x
P(x)=
30
The total number of U.S. men of age 65 and older living below the poverty level is given by the function
(x) m(x) p(x) 100 million men
(b) How rapidly was the number of male senior citizens living below the poverty level changing in 1985 and in 1995? (Round your answer to three decimal places.)
million men per year
1985
million men per year
1995
Expert Solution
This question has been solved!
Explore an expertly crafted, step-by-step solution for a thorough understanding of key concepts.

This is a popular solution!

Trending now
This is a popular solution!

Step by step
Solved in 4 steps with 4 images

Recommended textbooks for you
Big Ideas Math A Bridge To Success Algebra 1: Stu…
Algebra
ISBN:
9781680331141
Author:
HOUGHTON MIFFLIN HARCOURT
Publisher:
Houghton Mifflin Harcourt

Glencoe Algebra 1, Student Edition, 9780079039897…
Algebra
ISBN:
9780079039897
Author:
Carter
Publisher:
McGraw Hill
Big Ideas Math A Bridge To Success Algebra 1: Stu…
Algebra
ISBN:
9781680331141
Author:
HOUGHTON MIFFLIN HARCOURT
Publisher:
Houghton Mifflin Harcourt
Glencoe Algebra 1, Student Edition, 9780079039897…
Algebra
ISBN:
9780079039897
Author:
Carter
Publisher:
McGraw Hill