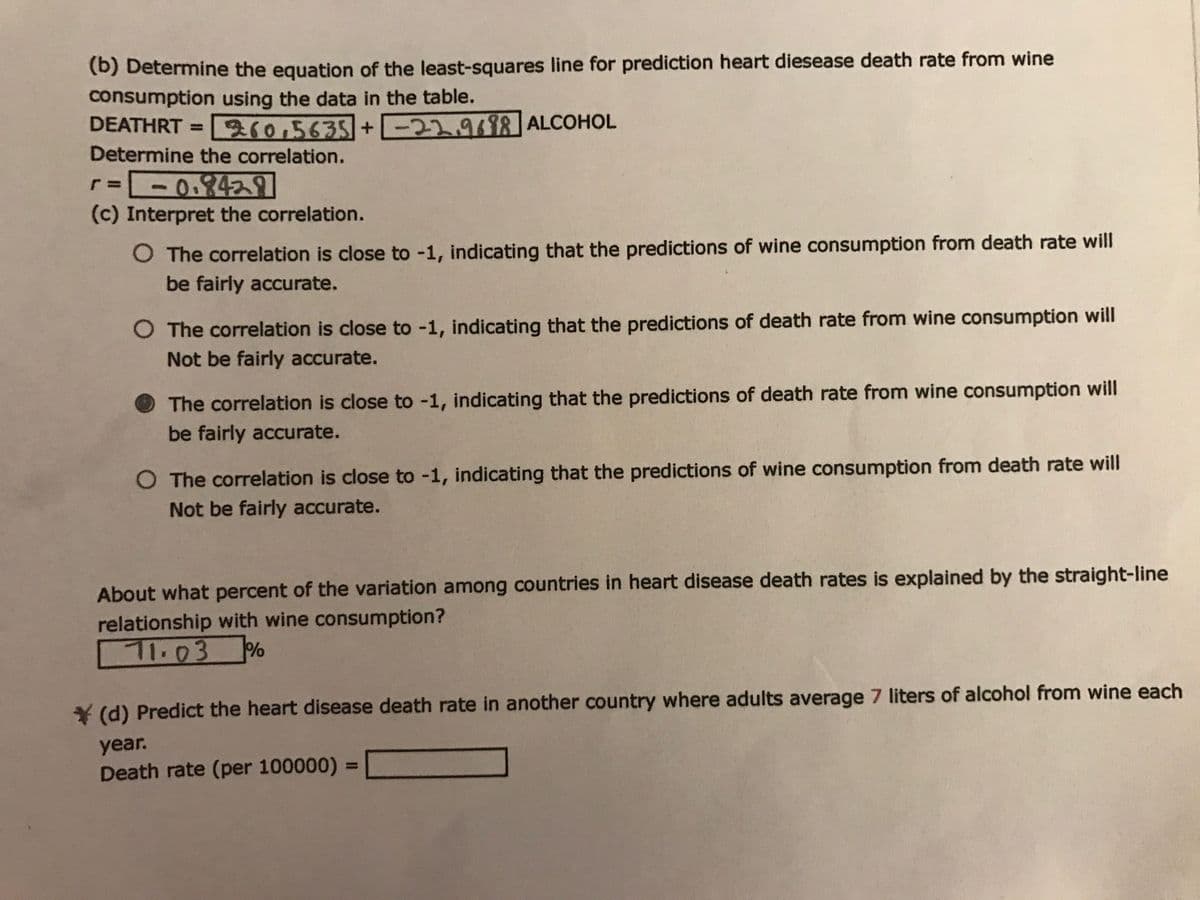
The table below gives data on average per capita wine consumption and heart disease rates in 19 countries. TABLE 3.6 Wine consumption and heart disease Alcohol from wine Heart disease death rate Alcohol Heart disease death rate (liters/year) (per 100,000) from wine Country Country (liters/year) (per 100,000) Australia 167 Netherlands New Zealand 2.5 211 1.8 Austria 3.9 167 1.9 266 227 Belgium/Lux. Canada Denmark 2.9 0.8 Norway Spain Sweden Switzerland United Kingdom United States West Germany 131 2.4 191 6.5 86 2.9 220 1.6 207 Finland 0.8 297 5.8 115 France 9.1 71 1.3 285 1.2 199 Iceland Ireland 0.8 211 0.7 300 2.7 172 Italy 7.9 107 Source: M. H. Criqui, University of California, San Diego, reported in the New York Times, December 28, 1994. (a) Construct a scatterplot for these data. (Do this on paper. Your instructor may ask you to turn in this graph.) Describe the relationship between the two variables. O There is a fairly weak negative association. O There is a fairly strong negative association. O There is a fairly strong positive association. O There is a fairly weak positive association.


Permutations and Combinations
If there are 5 dishes, they can be relished in any order at a time. In permutation, it should be in a particular order. In combination, the order does not matter. Take 3 letters a, b, and c. The possible ways of pairing any two letters are ab, bc, ac, ba, cb and ca. It is in a particular order. So, this can be called the permutation of a, b, and c. But if the order does not matter then ab is the same as ba. Similarly, bc is the same as cb and ac is the same as ca. Here the list has ab, bc, and ac alone. This can be called the combination of a, b, and c.
Counting Theory
The fundamental counting principle is a rule that is used to count the total number of possible outcomes in a given situation.
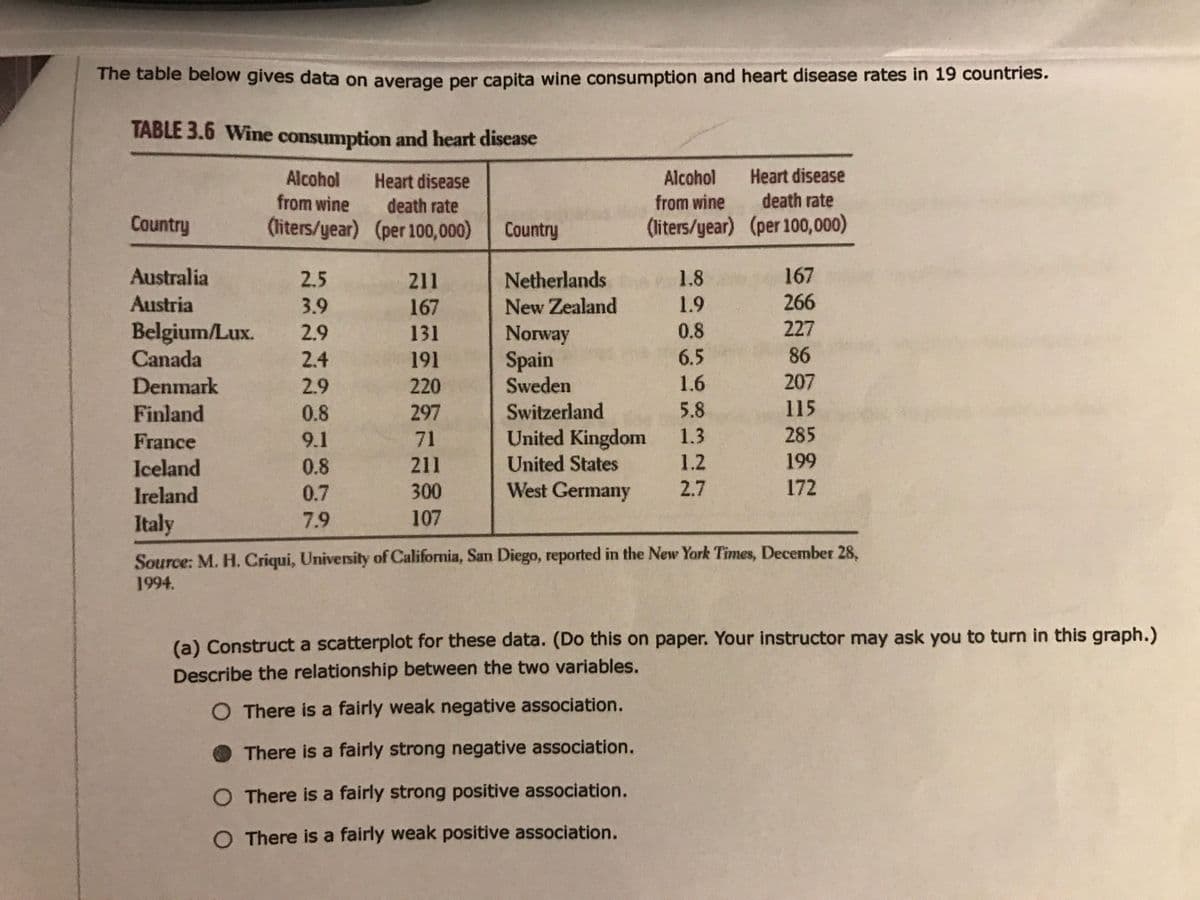
I am ONLY looking for d). This is the second time I have asked the same question. I split it into 2 parts for a larger text size like was requested. Thanks


Trending now
This is a popular solution!

Step by step
Solved in 2 steps


