A retailer wants to see if a red "Sale" sign brings in the same amount of revenue than the same "Sale" sign in blue. The data below shows the revenue in thousands of dollars that was achieved fc various days when the retailer decided to put the red "Sale" sign up and days when the retailer decided to put the blue "Sale" sign up. Red: 3.5, 3.6, 2.8, 1.6, 3.6, 3, 2.2, 3.2 Blue: 2.9, 3.2, 2.6, 2.8, 3.8, 3.6, 3, 4.9
A retailer wants to see if a red "Sale" sign brings in the same amount of revenue than the same "Sale" sign in blue. The data below shows the revenue in thousands of dollars that was achieved fc various days when the retailer decided to put the red "Sale" sign up and days when the retailer decided to put the blue "Sale" sign up. Red: 3.5, 3.6, 2.8, 1.6, 3.6, 3, 2.2, 3.2 Blue: 2.9, 3.2, 2.6, 2.8, 3.8, 3.6, 3, 4.9

Glencoe Algebra 1, Student Edition, 9780079039897, 0079039898, 2018
18th Edition
ISBN:9780079039897
Author:Carter
Publisher:Carter
Chapter10: Statistics
Section10.5: Comparing Sets Of Data
Problem 26PFA

Related questions
Topic Video
Question
NEED ANSWERS ASAP PLEASE
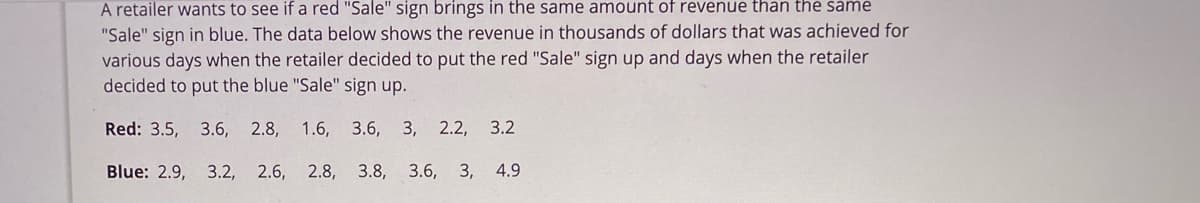
Transcribed Image Text:A retailer wants to see if a red "Sale" sign brings in the same amount of revenue than the same
"Sale" sign in blue. The data below shows the revenue in thousands of dollars that was achieved for
various days when the retailer decided to put the red "Sale" sign up and days when the retailer
decided to put the blue "Sale" sign up.
Red: 3.5, 3.6, 2.8,
1.6, 3.6, 3, 2.2, 3.2
Blue: 2.9, 3.2, 2.6, 2.8, 3.8, 3.6,
3,
4.9
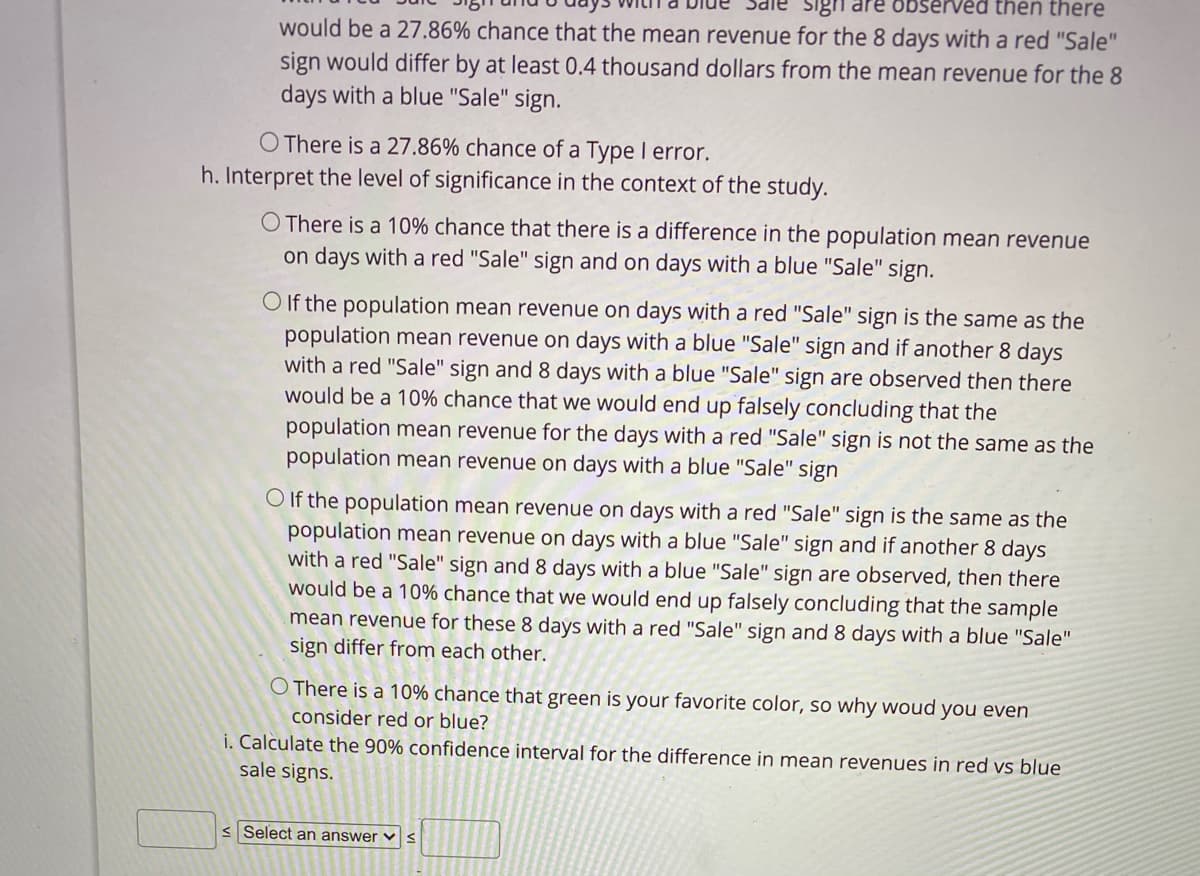
Transcribed Image Text:Observed thên there
uis aip
would be a 27.86% chance that the mean revenue for the 8 days with a red "Sale"
sign would differ by at least 0.4 thousand dollars from the mean revenue for the 8
days with a blue "Sale" sign.
O There is a 27.86% chance of a Type I error.
h. Interpret the level of significance in the context of the study.
O There is a 10% chance that there is a difference in the population mean revenue
on days with a red "Sale" sign and on days with a blue "Sale" sign.
O If the population mean revenue on days with a red "Sale" sign is the same as the
population mean revenue on days with a blue "Sale" sign and if another 8 days
with a red "Sale" sign and 8 days with a blue "Sale" sign are observed then there
would be a 10% chance that we would end up falsely concluding that the
population mean revenue for the days with a red "Sale" sign is not the same as the
population mean revenue on days with a blue "Sale" sign
O If the population mean revenue on days with a red "Sale" sign is the same as the
population mean revenue on days with a blue "Sale" sign and if another 8 days
with a red "Sale" sign and 8 days with a blue "Sale" sign are observed, then there
would be a 10% chance that we would end up falsely concluding that the sample
mean revenue for these 8 days with a red "Sale" sign and 8 days with a blue "Sale"
sign differ from each other.
O There is a 10% chance that green is your favorite color, so why woud you even
consider red or blue?
i. Calculate the 90% confidence interval for the difference in mean revenues in red vs blue
sale signs.
< Select an answer vS
Expert Solution
This question has been solved!
Explore an expertly crafted, step-by-step solution for a thorough understanding of key concepts.

Step by step
Solved in 2 steps

Knowledge Booster


Learn more about
Need a deep-dive on the concept behind this application? Look no further. Learn more about this topic, statistics and related others by exploring similar questions and additional content below.Recommended textbooks for you
Glencoe Algebra 1, Student Edition, 9780079039897…
Algebra
ISBN:
9780079039897
Author:
Carter
Publisher:
McGraw Hill

Big Ideas Math A Bridge To Success Algebra 1: Stu…
Algebra
ISBN:
9781680331141
Author:
HOUGHTON MIFFLIN HARCOURT
Publisher:
Houghton Mifflin Harcourt

Holt Mcdougal Larson Pre-algebra: Student Edition…
Algebra
ISBN:
9780547587776
Author:
HOLT MCDOUGAL
Publisher:
HOLT MCDOUGAL
Glencoe Algebra 1, Student Edition, 9780079039897…
Algebra
ISBN:
9780079039897
Author:
Carter
Publisher:
McGraw Hill
Big Ideas Math A Bridge To Success Algebra 1: Stu…
Algebra
ISBN:
9781680331141
Author:
HOUGHTON MIFFLIN HARCOURT
Publisher:
Houghton Mifflin Harcourt
Holt Mcdougal Larson Pre-algebra: Student Edition…
Algebra
ISBN:
9780547587776
Author:
HOLT MCDOUGAL
Publisher:
HOLT MCDOUGAL
