A sales manager collected the following data on annual sales for new customer accounts and the number of years of experience for a sample salespersons. Years of Annual Sales Salesperson Experience ($1000s) 1 1 80 2 3 82 3 96 4 95 93 6. 7 93 7 8 98 8. 10 106 11 121 10 13 125 The data on 24 - annual sales (81000s) for new customer ac counts and r pumber of vears of experience for a sample of 10 salespersons
A sales manager collected the following data on annual sales for new customer accounts and the number of years of experience for a sample salespersons. Years of Annual Sales Salesperson Experience ($1000s) 1 1 80 2 3 82 3 96 4 95 93 6. 7 93 7 8 98 8. 10 106 11 121 10 13 125 The data on 24 - annual sales (81000s) for new customer ac counts and r pumber of vears of experience for a sample of 10 salespersons

Glencoe Algebra 1, Student Edition, 9780079039897, 0079039898, 2018
18th Edition
ISBN:9780079039897
Author:Carter
Publisher:Carter
Chapter10: Statistics
Section10.5: Comparing Sets Of Data
Problem 14PPS

Related questions
Topic Video
Question
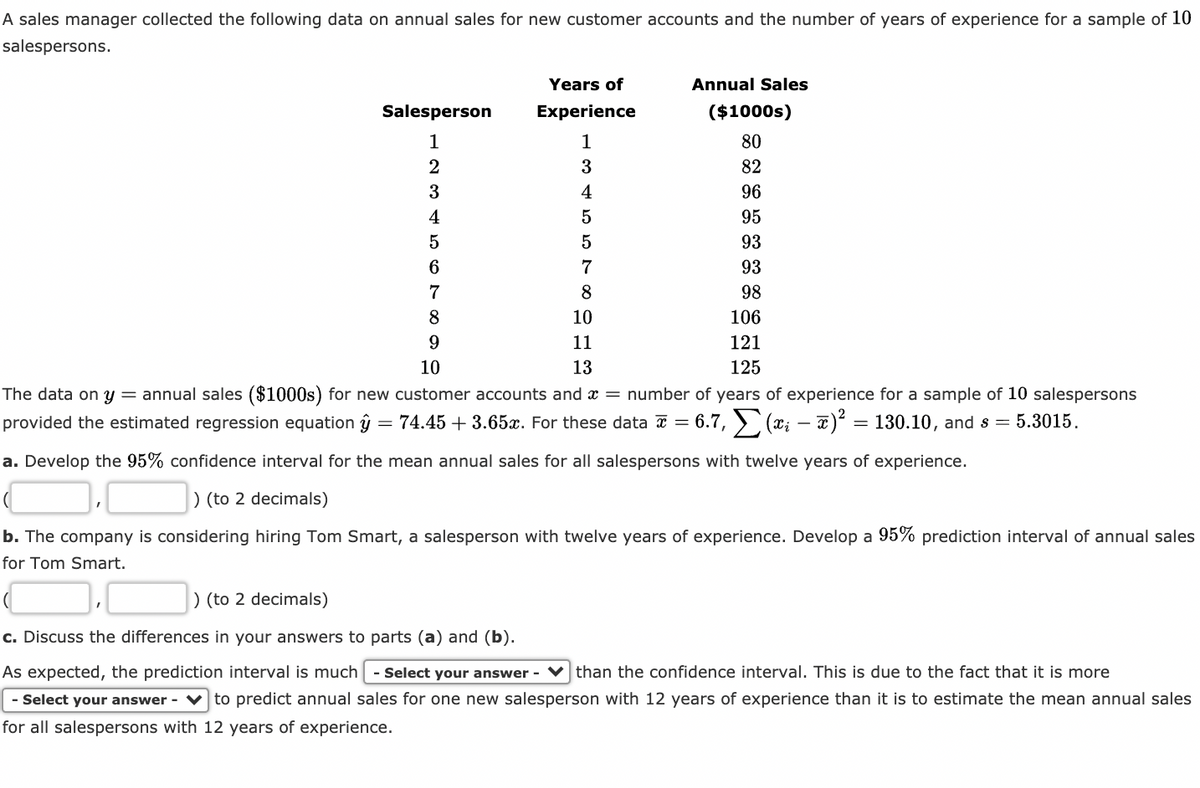
Transcribed Image Text:A sales manager collected the following data on annual sales for new customer accounts and the number of years of experience for a sample of 10
salespersons.
Years of
Annual Sales
Salesperson
Experience
($1000s)
1
1
80
3
82
3
4
96
4
5
95
5
93
6.
7
93
7
8
98
8
10
106
11
121
10
13
125
The data on y = annual sales ($1000s) for new customer accounts and x = number of years of experience for a sample of 10 salespersons
provided the estimated regression equation ŷ = 74.45 + 3.65x. For these data a = 6.7, ) (x; - x)² = 130.10, and s = 5.3015.
%3D
a. Develop the 95% confidence interval for the mean annual sales for all salespersons with twelve years of experience.
) (to 2 decimals)
b. The company is considering hiring Tom Smart, a salesperson with twelve years of experience. Develop a 95% prediction interval of annual sales
for Tom Smart.
) (to 2 decimals)
c. Discuss the differences in your answers to parts (a) and (b).
As expected, the prediction interval is much
- Select your answer - V than the confidence interval. This is due to the fact that it is more
- Select your answer -
to predict annual sales for one new salesperson with 12 years of experience than it is to estimate the mean annual sales
for all salespersons with 12 years of experience.
Expert Solution
This question has been solved!
Explore an expertly crafted, step-by-step solution for a thorough understanding of key concepts.

This is a popular solution!

Trending now
This is a popular solution!

Step by step
Solved in 4 steps

Knowledge Booster


Learn more about
Need a deep-dive on the concept behind this application? Look no further. Learn more about this topic, statistics and related others by exploring similar questions and additional content below.Recommended textbooks for you
Glencoe Algebra 1, Student Edition, 9780079039897…
Algebra
ISBN:
9780079039897
Author:
Carter
Publisher:
McGraw Hill
Glencoe Algebra 1, Student Edition, 9780079039897…
Algebra
ISBN:
9780079039897
Author:
Carter
Publisher:
McGraw Hill