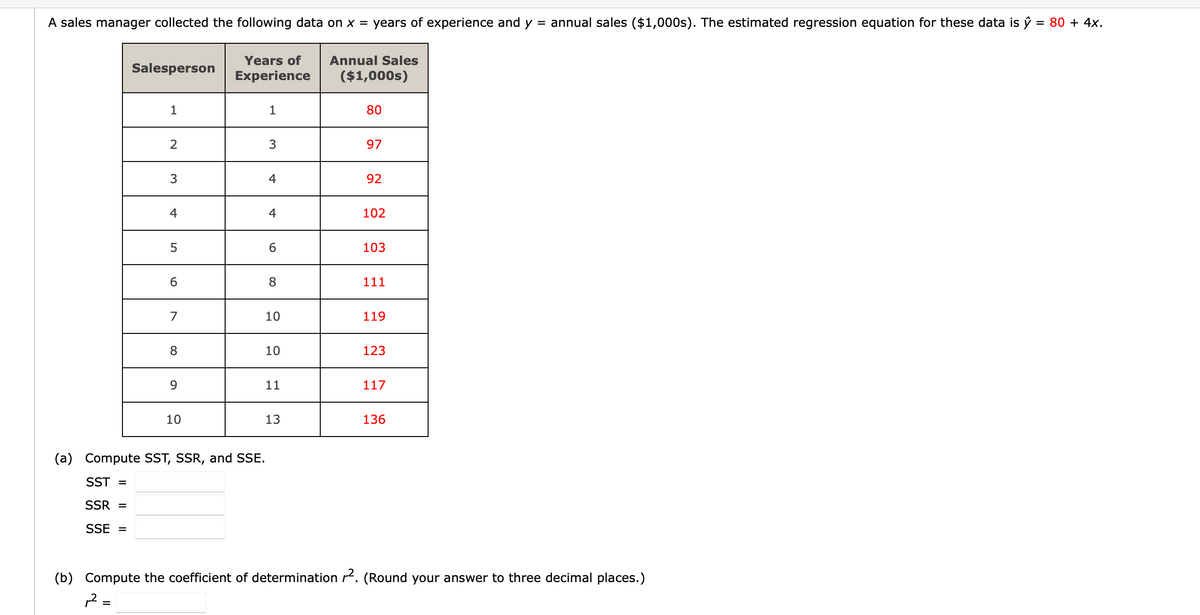
A sales manager collected the following data on x = years of experience and y = annual sales ($1,000s). The estimated regression equation for these data is ŷ = 80 + 4x. Years of Annual Sales Salesperson Experience ($1,000s) 1. 1 80 2 97 4 92 4 4 102 6 103 8 111 7 10 119 8 10 123 11 117 10 13 136 (a) Compute SST, SSR, and SSE. SST = SSR = SSE = (b) Compute the coefficient of determination 2. (Round your answer to three decimal places.)
A sales manager collected the following data on x = years of experience and y = annual sales ($1,000s). The estimated regression equation for these data is ŷ = 80 + 4x. Years of Annual Sales Salesperson Experience ($1,000s) 1. 1 80 2 97 4 92 4 4 102 6 103 8 111 7 10 119 8 10 123 11 117 10 13 136 (a) Compute SST, SSR, and SSE. SST = SSR = SSE = (b) Compute the coefficient of determination 2. (Round your answer to three decimal places.)

Chapter4: Linear Functions
Section: Chapter Questions
Problem 30PT: For the following exercises, use Table 4 which shows the percent of unemployed persons 25 years or...

Related questions
Question
Transcribed Image Text:A sales manager collected the following data on x = years of experience and y = annual sales ($1,000s). The estimated regression equation for these data is ŷ
= 80 + 4xX.
Years of
Annual Sales
Salesperson
Experience
($1,000s)
1
1
80
2
3
97
3
4
92
4
4
102
6.
103
8
111
7
10
119
8
10
123
9
11
117
10
13
136
(a) Compute SST, SSR, and SSE.
SST =
SSR =
SSE =
(b) Compute the coefficient of determination r. (Round your answer to three decimal places.)
p? =
%3D

Transcribed Image Text:(c) What is the value of the sample correlation coefficient? (Round your answer to three decimal places.)
Expert Solution
Step 1
( a )
SST = ?
SSR = ?
SSE = ?
( b )
r^2 = ?
( c )
r = ?

Trending now
This is a popular solution!

Step by step
Solved in 2 steps with 1 images

Recommended textbooks for you

Functions and Change: A Modeling Approach to Coll…
Algebra
ISBN:
9781337111348
Author:
Bruce Crauder, Benny Evans, Alan Noell
Publisher:
Cengage Learning

College Algebra
Algebra
ISBN:
9781305115545
Author:
James Stewart, Lothar Redlin, Saleem Watson
Publisher:
Cengage Learning
Functions and Change: A Modeling Approach to Coll…
Algebra
ISBN:
9781337111348
Author:
Bruce Crauder, Benny Evans, Alan Noell
Publisher:
Cengage Learning
College Algebra
Algebra
ISBN:
9781305115545
Author:
James Stewart, Lothar Redlin, Saleem Watson
Publisher:
Cengage Learning

Algebra and Trigonometry (MindTap Course List)
Algebra
ISBN:
9781305071742
Author:
James Stewart, Lothar Redlin, Saleem Watson
Publisher:
Cengage Learning