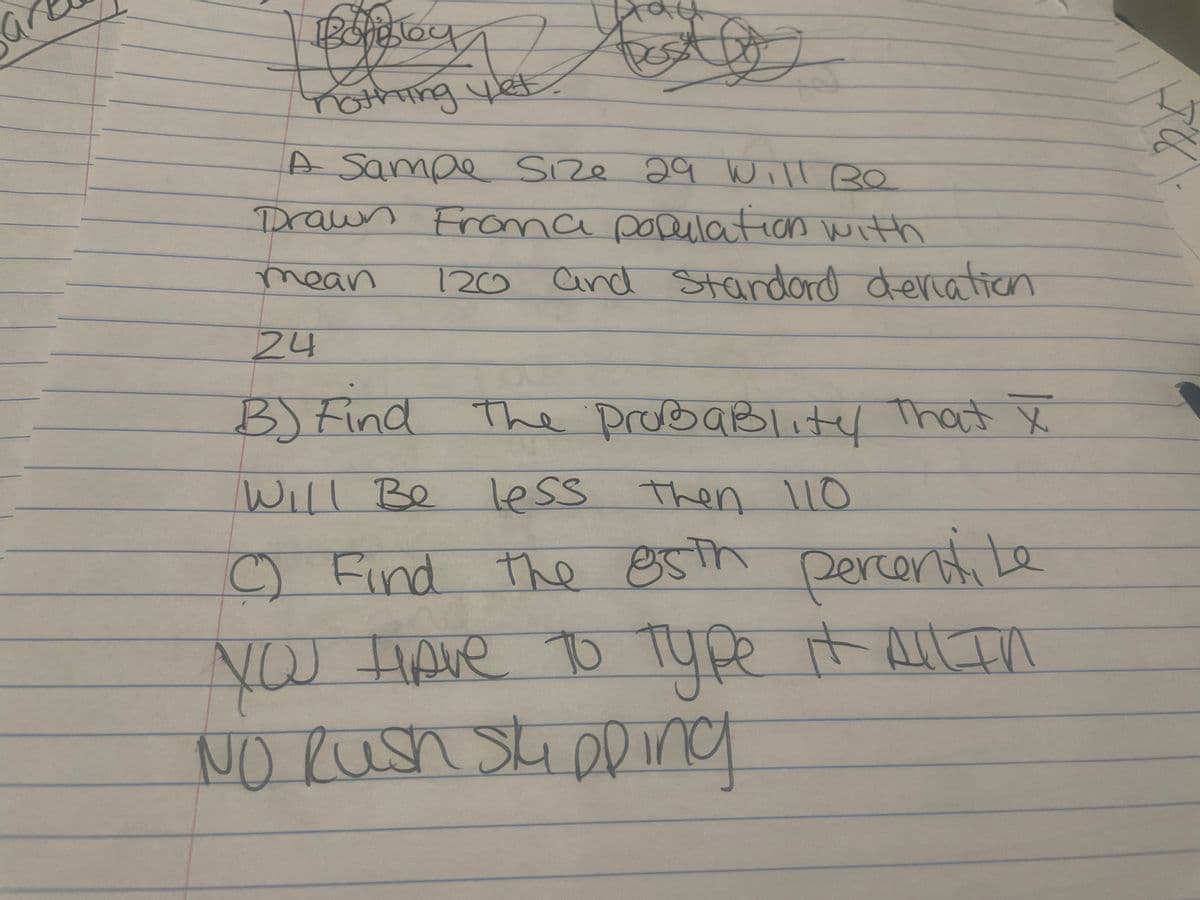
A Sampe Size 29 Will Be Drawn Froma population with. 120 and Standard deviation mean 24 B) Find the probaBlity That X Will Be less then 110 (C) Find the 85th percentile YOU tipve to type it All In NO Rush Shipping
Q: 2. Researchers are trying to determine if there is a relationship between the average number of Pets…
A: The following solution is given below :
Q: Answer the following to summarize the test of the hypothesis that there is no relationship between…
A: Chi square is the type of parametric test. There are three types of chi square test. It is based on…
Q: onsider the following set of ordered pairs. Complete parts a thro 1 30 2 4 KX y 59 + SE= SR= 8…
A: Given
Q: The following estimated regression model was developed relating yearly income (y in $1000s) of 30…
A: Hint: First we find the SSR and then taking the value of f-statistic, to decide the significance of…
Q: Does the claim represent the null hypothesis or the alternative hypothesis? Since the claim a…
A: The claim is that at most 12% of people had no health card visits in the past year.
Q: Pet Ownership The 2006 Statistical Abstract of the United States reports on a survey that asked a…
A: “Since you have posted a question with multiple sub-parts, we will solve the first three sub-parts…
Q: Question 5: You have decided you will spend $1600 on housing every month. Therefore, you will be…
A: Given data You have decided you will spend $1600 on housing every month. Therefore, you will be…
Q: Section 10.2 10.15 10.16 10.170 Fill in the blank by choosing one of the options given: Chi-square…
A: Given that Fill in the blank by choosing one of the options given: Chi-square goodness-of-fit tests…
Q: 3. The decision-making process A graduate student believes that people consider faces with more…
A: Given info: A graduate student believes that people consider faces with more contrast between eye…
Q: 489 Section 9.2 9.11 Babies Weights (Example 20) Some sources report that the weights of full-term…
A: Formula : z = (x̄ - μₓ̄ )/σₓ̄
Q: The mean starting salary offered to graduating students with a certain major in a recent year was…
A: Mean(µ) = 64260Standard deviations (σ) = 3643X ~ N (µ, σ )= N(64260,3643) n = 80
Q: or the first blank my options are a. 3.95 b. 9.1 c. 4
A: years precipitation 1994 9.4 1995 17 1996 7.3 1997 7 1998 16.1 1999 5.4 2000 6.9…
Q: Give the five-number summary and the interquartile range for the data set. Five-number summary…
A: It is given that the ages of 13 mathematics teachers in a school district are: 28, 29, 31, 31, 34,…
Q: The marks obtained by 11 students as follows. You calculate quartile deviation and its coefficient.…
A:
Q: The results shown to the right provide the X-values, residuals, and a residual plot from a…
A: Given data A residual plot from a regression analysis is given
Q: Given the following x and y data, what is the value of the correlation coefficient r? X 8 7 6 5 4 3…
A: From the provided information, X 8 7 6 5 4 3 2 1 Y 8 7 6 5 4 3…
Q: State whether the standardized test statistic t indicates that you should reject the null…
A: Given data The rejection region is t>1.845
Q: 6. Here are some exam scores (there were 9 exams) from my three best Stats students at Napa High…
A:
Q: For the statement below, write the claim as a mathematical statement. State the null and alternative…
A:
Q: An electronics retailer would like to investigate the relationship between the selling price of a…
A: The sample correlation coefficient is -0.852.
Q: Samples The target value for a pal of size five are taken at regular intervals and the average…
A: Given: The target value for a particular process is T=50. Samples of size n=5 are taken at random…
Q: Determine the percentage of scores for a normal curve between z = 1.10 and z =-0.35 (Feel free to…
A: The objective is to determine the percentage of scores for a normal curve between z=1.10 and…
Q: A certain test is designed to measure the satisfaction of an individual with his/her relationship.…
A: The following information has been provided: Let X be a random variable represents the…
Q: The polynomial regression model of degreer is given by Y₁ =B₁ + B₁X₁ + B₂X² + ... + B₂X[ + +Uj.…
A: When a polynomial equation is used to fit on the data with a curvilinear relationship between the…
Q: software system. In planning for the operating system that he will use, he needs to estimate the…
A: Given that Margin of error =E =5%=0.05
Q: A regression model involving 4 independent variables and a sample of 15 periods resulted in the…
A:
Q: 3 Salaries of college and non-college graduates were compared. Results are shown below: Educ Level…
A: Chi square test are used to determine the independency between the variable. Chi square test use…
Q: A bag contains 9 Blue balls, 5 Red balls, and 7 Green balls. Two balls are going to be drawn from…
A:
Q: Find the (a) mean, (b) median, (c) mode, and (d) midrange for the data and then (e) answer the given…
A:
Q: Listed below are systolic blood pressure measurements (in mm Hg) obtained from the same woman. Find…
A:
Q: At most 33% of workers indicate that they are dissatisfied with their job. Express the null and…
A: The claim is that at most 33% of workers indicate that they are dissatisfied with their job.
Q: The residents of a city voted on whether to raise property taxes. The ratio of yes votes to no votes…
A:
Q: Suppose that in a random selection of 100 colored candies, 21% of them are blue. The candy company…
A: We have given thatn = 100p̂ = 0.21p = 0.25Significance level (α) = 0.10 The null and alternative…
Q: (a) Find the five-number summary, and (b) draw a box-and-whisker plot of the data. 38 85 2987…
A: Given data is3,8,8,5,2,9,8,7,9,6,9,4,1,6,2,9,8,7,7,9sample size(n)=20
Q: Consider the multiple regression model shown next between the dependent variable Y and four…
A:
Q: Let X, Y be positive random variables (not necessarily independent). Assuming X, Y have all finite…
A: Since you have posted a question with multiple sub parts, according to our guidelines we can solve…
Q: The probability that a birth will result in twins is 0.014. Assuming independence (perhaps not a…
A: Given that p = 0.014n = 100 Here we will use binomial distribution X ~Binomial(n, p) X ~ Binomial…
Q: items produced 3. In the past the average proportion of by a certain process has been 3 per cent and…
A: Given that, p¯=0.03 Sample size, n is 30
Q: The average price of a gallon of milk 2000 was $3.15. A sample of 250 stores across the nation in…
A:
Q: 9.51 Student Ages Suppose that 200 statistics students each took a random sample (with replacement)…
A: Hint: By simple calculation of confidence interval we can solve this.
Q: Assume now, that the largest observation in this dataset is 90. If this observation were wrongly…
A: Answer and explanation given in steps below.
Q: A study was done to look at the relationship between number of lovers college students have had in…
A: “Since you have posted a question with multiple sub-parts, we will solve the first three sub-parts…
Q: Students took a college math placement exam with a mean of 200 and a standard deviation of 12. Using…
A: Given that, μ=200σ=12
Q: An IQ test is designed so that the mean is 100 and the standard deviation is 16 for the population…
A: The following information has been provided: x¯=100σ=16
Q: A variable of two populations has a mean of 49 and a standard deviation of 14 for one of the…
A: Solution
Q: The number of credits being taken by a sample of 13 full-time college students are listed below.…
A: Given that Data : 5 7 8 8 5 6 4 4 4 4 4 4 5 We have to find mean, median and mode of data
Q: Use the above scatter plot to decide whether the linear model fits the data well. The function is a…
A: Given data: Year Retail sales 0 85.851 3 108.426 6 141.781 9 169.256 12 202.297 15…
Q: Consider the following AR(3) process, X₁ = (a₁-a₂)X₁-1 + (a₁a2-a3)X₁-2 + a₁a3X₁-3 + Zt.
A:
Q: 6. Which of these relationships would be better described with a Spearman's rank coefficient than…
A: The association between ice cream sales and crime rates. This one relationships would be better…
Q: The following table shows the selling prices, in thousands of dollars, and the square footages of…
A: The given correlation coefficient is 0.545.
Step by step
Solved in 3 steps