A sample is given from the values of the EV/Net Income index (an indicator that compares the value of an enterprise with its net profit) for 100 enterprises of this industry. 1. Make an interval variation series. 2.Plot a histogram of relative frequencies N.b) the first image is the table for the task and the second image(descriptive statistics), is describe the steps you should follow for the assignment.
A sample is given from the values of the EV/Net Income index (an indicator that compares the value of an enterprise with its net profit) for 100 enterprises of this industry. 1. Make an interval variation series. 2.Plot a histogram of relative frequencies N.b) the first image is the table for the task and the second image(descriptive statistics), is describe the steps you should follow for the assignment.

College Algebra (MindTap Course List)
12th Edition
ISBN:9781305652231
Author:R. David Gustafson, Jeff Hughes
Publisher:R. David Gustafson, Jeff Hughes
Chapter8: Sequences, Series, And Probability
Section8.CT: Chapter Test
Problem 16CT: How many six-digit license plates can be made if no plate begins with 0 or 1?

Related questions
Question
100%
A sample is given from the values of the EV/Net Income index (an indicator that compares
the value of an enterprise with its net profit) for 100 enterprises of this
industry.
1. Make an interval variation series.
2.Plot a histogram of relative frequencies
N.b) the first image is the table for the task and the second image(
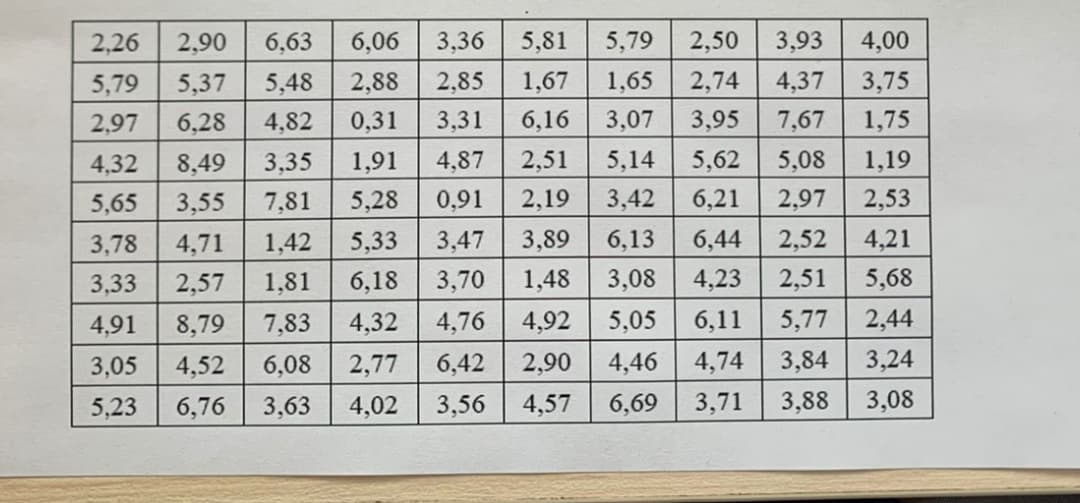
Transcribed Image Text:2,26
2,90
6,63
6,06
3,36
5,81
5,79
2,50
3,93
4,00
5,79
5,37
5,48
2,88
2,85
1,67
1,65
2,74
4,37
3,75
2,97
6,28
4,82
0,31
3,31
6,16
3,07
3,95
7,67
1,75
5,14
5,62
6,21
6,44
4,32
8,49
3,35
1,91
4,87
2,51
5,08
1,19
5,65
3,55
7,81
5,28
0,91
2,19
3,42
2,97
2,53
3,78
4,71
1,42
5,33
3,47
3,89
6,13
2,52
4,21
3,33
2,57
1,81
6,18
3,70
1,48
3,08
4,23
2,51
5,68
4,91
8,79
7,83
4,32
4,76
4,92
5,05
6,11
5,77
2,44
3,05
4,52
6,08
2,77
6,42
2,90
4,46
4,74
3,84
3,24
5,23
6,76
3,63
4,02
3,56
4,57
6,69
3,71
3,88
3,08
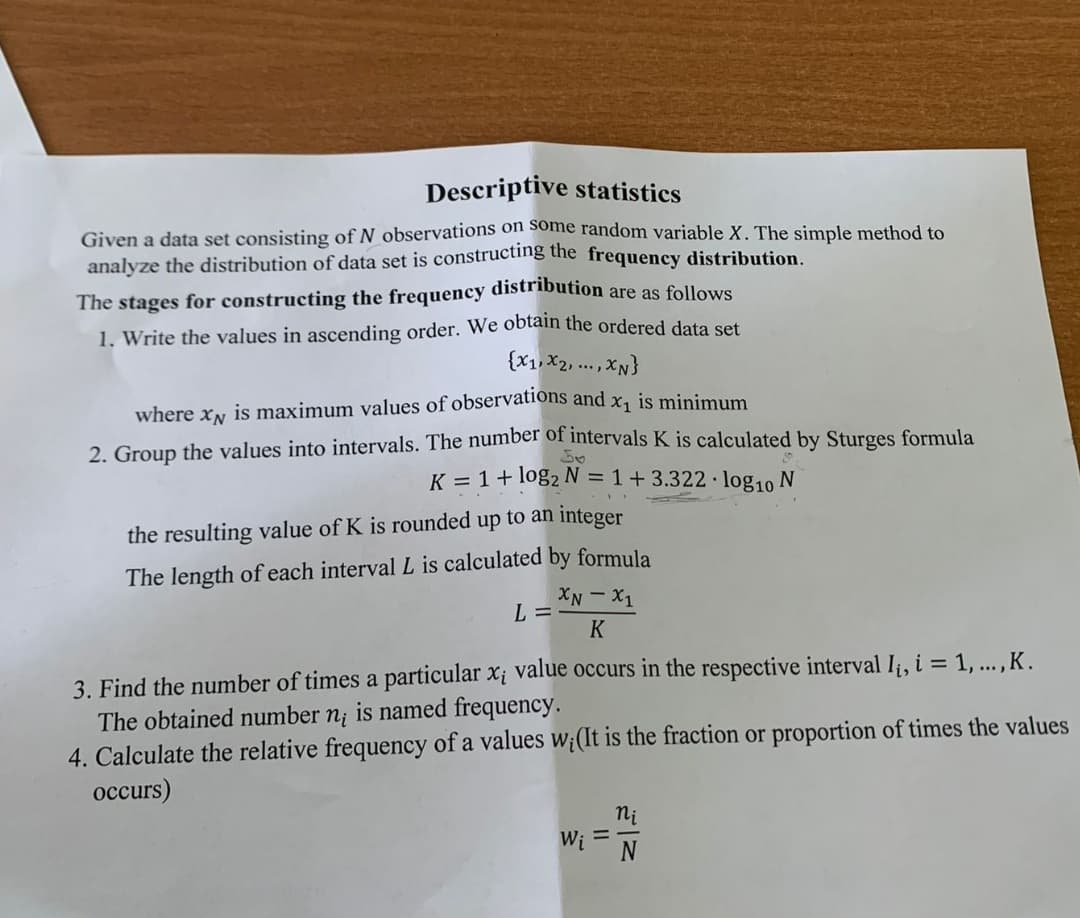
Transcribed Image Text:Descriptive statistics
Given a data set consisting of N observations on some random variable X. The simple method to
analyze the distribution of data set is constructing the frequency distribution.
The stages for constructing the frequency distribution are as follows
1. Write the values in ascending order. We obtain the ordered data set
{X1, X2, ...,XN}
where xN is maximum values of observations and x, is minimum
2. Group the values into intervals. The number of intervals K is calculated by Sturges formula
K = 1+ log2 N = 1+3.322· log10 N
the resulting value of K is rounded up to an integer
The length of each interval L is calculated by formula
Ix - NX
K
L =
3. Find the number of times a particular x¡ value occurs in the respective interval Ii, i = 1, ... , K.
The obtained number n; is named frequency.
4. Calculate the relative frequency of a values w;(It is the fraction or proportion of times the values
occurs)
ni
W; =
Expert Solution
This question has been solved!
Explore an expertly crafted, step-by-step solution for a thorough understanding of key concepts.

Step by step
Solved in 3 steps with 1 images

Recommended textbooks for you
College Algebra (MindTap Course List)
Algebra
ISBN:
9781305652231
Author:
R. David Gustafson, Jeff Hughes
Publisher:
Cengage Learning


College Algebra (MindTap Course List)
Algebra
ISBN:
9781305652231
Author:
R. David Gustafson, Jeff Hughes
Publisher:
Cengage Learning