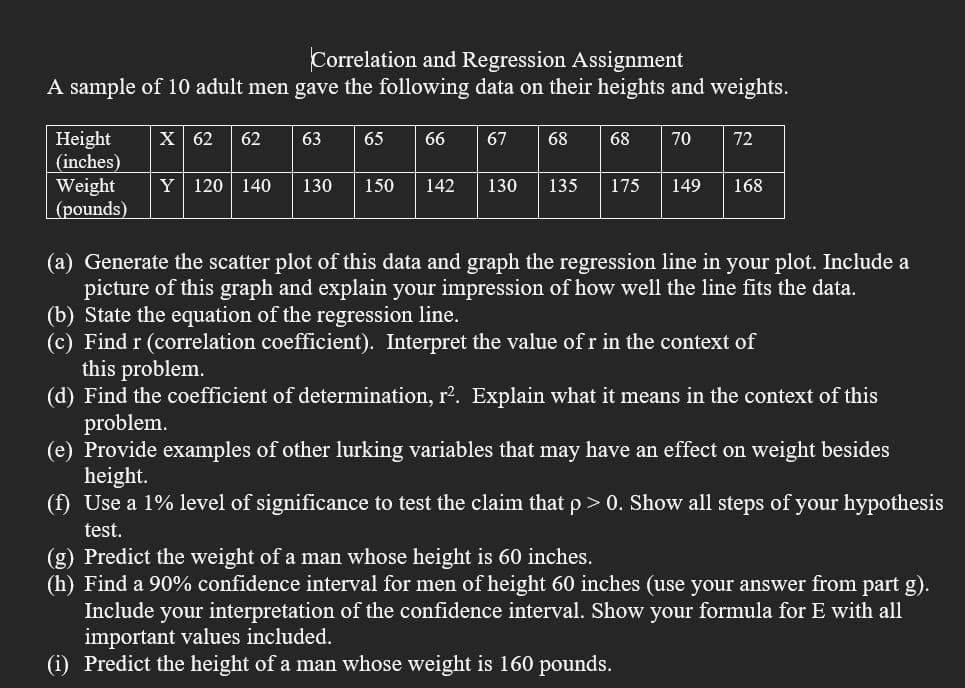
Correlation and Regression Assignment A sample of 10 adult men gave the following data on their heights and weights. Height X 62 62 63 65 66 67 68 68 70 72 (inches) Y 120 140 30 150 142 130 135 175 149 168 Weight (pounds) (a) Generate the scatter plot of this data and graph the regression line in your plot. Include a picture of this graph and explain your impression of how well the line fits the data. (b) State the equation of the regression line. (c) Find r (correlation coefficient). Interpret the value of r in the context of this problem. (d) Find the coefficient of determination, r². Explain what it means in the context of this problem. (e) Provide examples of other lurking variables that may have an effect on weight besides height. (f) Use a 1% level of significance to test the claim that p > 0. Show all steps of your hypothesis test. (g) Predict the weight of a man whose height is 60 inches. (h) Find a 90% confidence interval for men of height 60 inches (use your answer from part g). Include your interpretation of the confidence interval. Show your formula for E with all important values included. (i) Predict the height of a man whose weight is 160 pounds.
Correlation and Regression Assignment A sample of 10 adult men gave the following data on their heights and weights. Height X 62 62 63 65 66 67 68 68 70 72 (inches) Y 120 140 30 150 142 130 135 175 149 168 Weight (pounds) (a) Generate the scatter plot of this data and graph the regression line in your plot. Include a picture of this graph and explain your impression of how well the line fits the data. (b) State the equation of the regression line. (c) Find r (correlation coefficient). Interpret the value of r in the context of this problem. (d) Find the coefficient of determination, r². Explain what it means in the context of this problem. (e) Provide examples of other lurking variables that may have an effect on weight besides height. (f) Use a 1% level of significance to test the claim that p > 0. Show all steps of your hypothesis test. (g) Predict the weight of a man whose height is 60 inches. (h) Find a 90% confidence interval for men of height 60 inches (use your answer from part g). Include your interpretation of the confidence interval. Show your formula for E with all important values included. (i) Predict the height of a man whose weight is 160 pounds.

Functions and Change: A Modeling Approach to College Algebra (MindTap Course List)
6th Edition
ISBN:9781337111348
Author:Bruce Crauder, Benny Evans, Alan Noell
Publisher:Bruce Crauder, Benny Evans, Alan Noell
Chapter3: Straight Lines And Linear Functions
Section3.CR: Chapter Review Exercises
Problem 16CR: XYZ Corporation Stock Prices The following table shows the average stock price, in dollars, of XYZ...

Related questions
Question
I need help with d-i
Transcribed Image Text:Correlation and Regression Assignment
A sample of 10 adult men gave the following data on their heights and weights.
Height X 62 62
63
65
66
67 68
68
70
72
(inches)
Y 120 140 30 150 142 130 135 175
149 168
Weight
(pounds)
(a) Generate the scatter plot of this data and graph the regression line in your plot. Include a
picture of this graph and explain your impression of how well the line fits the data.
(b) State the equation of the regression line.
(c) Find r (correlation coefficient). Interpret the value of r in the context of
this problem.
(d) Find the coefficient of determination, r². Explain what it means in the context of this
problem.
(e) Provide examples of other lurking variables that may have an effect on weight besides
height.
(f) Use a 1% level of significance to test the claim that p > 0. Show all steps of your hypothesis
test.
(g) Predict the weight of a man whose height is 60 inches.
(h) Find a 90% confidence interval for men of height 60 inches (use your answer from part g).
Include your interpretation of the confidence interval. Show your formula for E with all
important values included.
(i) Predict the height of a man whose weight is 160 pounds.
Expert Solution
This question has been solved!
Explore an expertly crafted, step-by-step solution for a thorough understanding of key concepts.

This is a popular solution!

Trending now
This is a popular solution!

Step by step
Solved in 3 steps with 3 images

Follow-up Questions
Read through expert solutions to related follow-up questions below.
Follow-up Question
e-i

Transcribed Image Text:Correlation and Regression Assignment
A sample of 10 adult men gave the following data on their heights and weights.
Height X 62 62
63
65
66
67 68
68
70
72
(inches)
Y 120 140 30 150 142 130 135 175
149 168
Weight
(pounds)
(a) Generate the scatter plot of this data and graph the regression line in your plot. Include a
picture of this graph and explain your impression of how well the line fits the data.
(b) State the equation of the regression line.
(c) Find r (correlation coefficient). Interpret the value of r in the context of
this problem.
(d) Find the coefficient of determination, r². Explain what it means in the context of this
problem.
(e) Provide examples of other lurking variables that may have an effect on weight besides
height.
(f) Use a 1% level of significance to test the claim that p > 0. Show all steps of your hypothesis
test.
(g) Predict the weight of a man whose height is 60 inches.
(h) Find a 90% confidence interval for men of height 60 inches (use your answer from part g).
Include your interpretation of the confidence interval. Show your formula for E with all
important values included.
(i) Predict the height of a man whose weight is 160 pounds.
Solution
Recommended textbooks for you
Functions and Change: A Modeling Approach to Coll…
Algebra
ISBN:
9781337111348
Author:
Bruce Crauder, Benny Evans, Alan Noell
Publisher:
Cengage Learning

Algebra and Trigonometry (MindTap Course List)
Algebra
ISBN:
9781305071742
Author:
James Stewart, Lothar Redlin, Saleem Watson
Publisher:
Cengage Learning

College Algebra (MindTap Course List)
Algebra
ISBN:
9781305652231
Author:
R. David Gustafson, Jeff Hughes
Publisher:
Cengage Learning
Functions and Change: A Modeling Approach to Coll…
Algebra
ISBN:
9781337111348
Author:
Bruce Crauder, Benny Evans, Alan Noell
Publisher:
Cengage Learning
Algebra and Trigonometry (MindTap Course List)
Algebra
ISBN:
9781305071742
Author:
James Stewart, Lothar Redlin, Saleem Watson
Publisher:
Cengage Learning
College Algebra (MindTap Course List)
Algebra
ISBN:
9781305652231
Author:
R. David Gustafson, Jeff Hughes
Publisher:
Cengage Learning

Glencoe Algebra 1, Student Edition, 9780079039897…
Algebra
ISBN:
9780079039897
Author:
Carter
Publisher:
McGraw Hill

College Algebra
Algebra
ISBN:
9781305115545
Author:
James Stewart, Lothar Redlin, Saleem Watson
Publisher:
Cengage Learning
