A sample of 13 small bags of the same brand of candies was selected. Assume that the population distribution of bag weights is normal. The weight of each bag was then recorded. The mean weight was 3 ounces with a standard deviation of 0.13 ounces. The population standard deviation is known to be 0.1 ounce.
A sample of 13 small bags of the same brand of candies was selected. Assume that the population distribution of bag weights is normal. The weight of each bag was then recorded. The mean weight was 3 ounces with a standard deviation of 0.13 ounces. The population standard deviation is known to be 0.1 ounce.

Chapter9: Sequences, Probability And Counting Theory
Section9.7: Probability
Problem 1SE: What term is used to express the likelihood of an event occurring? Are there restrictions on its...

Related questions

Question
A sample of 13 small bags of the same brand of candies was selected. Assume that the population distribution of bag weights is normal. The weight of each bag was then recorded. The mean weight was 3 ounces with a standard deviation of 0.13 ounces. The population standard deviation is known to be 0.1 ounce.
NOTE: If you are using a Student's t-distribution, you may assume that the underlying population is
SUBPART
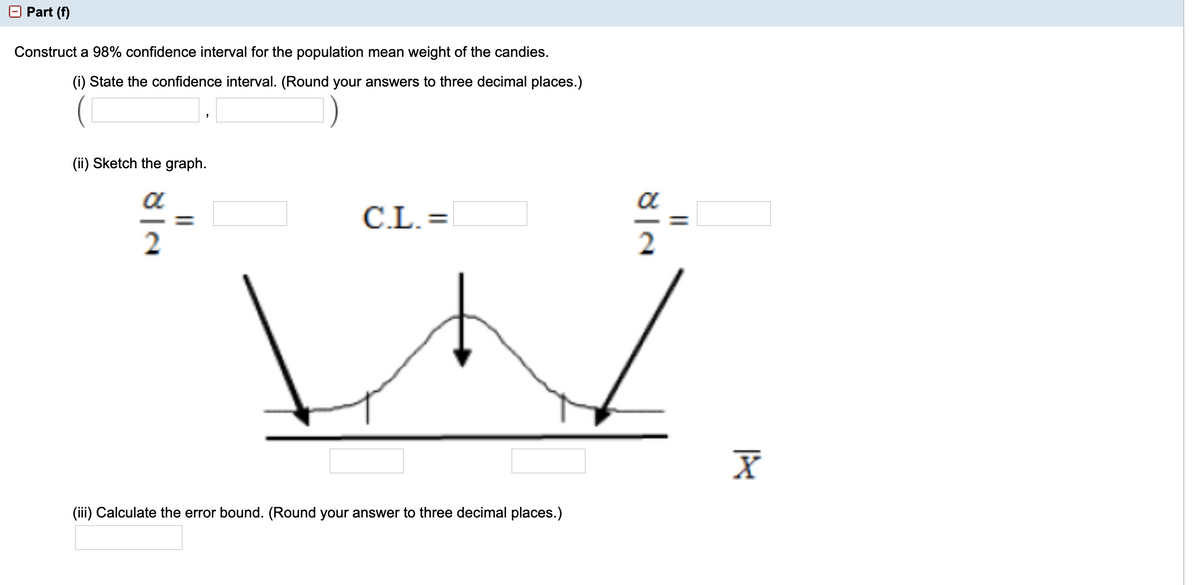
Transcribed Image Text:E Part (f)
Construct a 98% confidence interval for the population mean weight of the candies.
(i) State the confidence interval. (Round your answers to three decimal places.)
(ii) Sketch the graph.
a
C.L. =
(iii) Calculate the error bound. (Round your answer to three decimal places.)
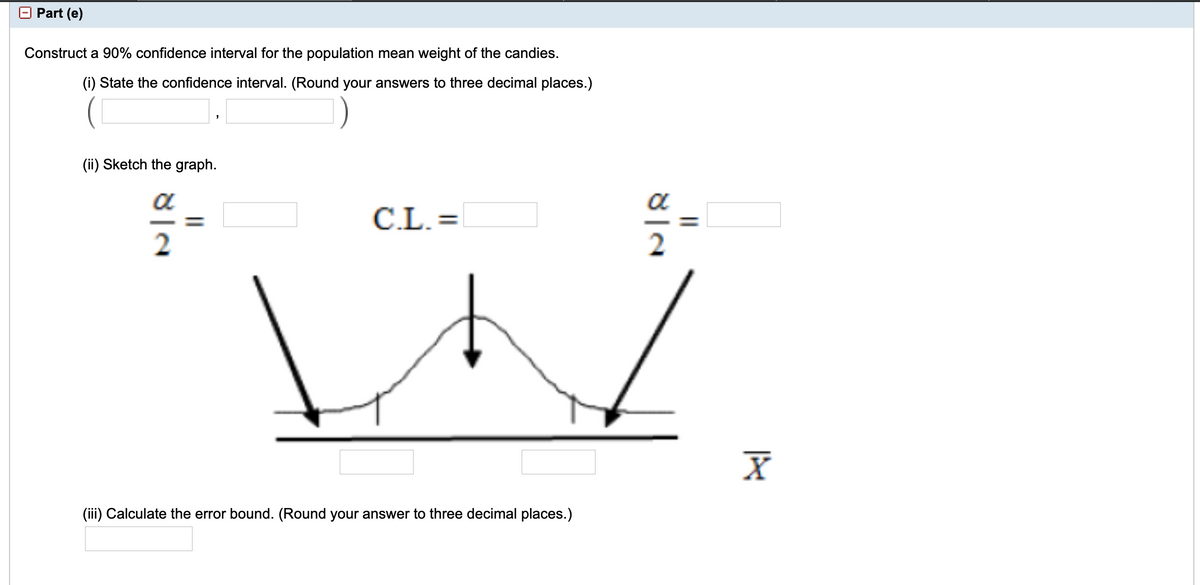
Transcribed Image Text:O Part (e)
Construct a 90% confidence interval for the population mean weight of the candies.
(i) State the confidence interval. (Round your answers to three decimal places.)
(ii) Sketch the graph.
a
a
C.L. =
2
(iii) Calculate the error bound. (Round your answer to three decimal places.)
Expert Solution
This question has been solved!
Explore an expertly crafted, step-by-step solution for a thorough understanding of key concepts.

This is a popular solution!

Trending now
This is a popular solution!

Step by step
Solved in 3 steps with 21 images

Knowledge Booster


Learn more about
Need a deep-dive on the concept behind this application? Look no further. Learn more about this topic, statistics and related others by exploring similar questions and additional content below.Recommended textbooks for you

College Algebra (MindTap Course List)
Algebra
ISBN:
9781305652231
Author:
R. David Gustafson, Jeff Hughes
Publisher:
Cengage Learning
College Algebra (MindTap Course List)
Algebra
ISBN:
9781305652231
Author:
R. David Gustafson, Jeff Hughes
Publisher:
Cengage Learning