A sample of 15 items provides a sample standard deviation of 7.3. Test the following hypotheses using alpha=.05. What is your conclusion? Use both the p-value approach and the critical value approach.
A sample of 15 items provides a sample standard deviation of 7.3. Test the following hypotheses using alpha=.05. What is your conclusion? Use both the p-value approach and the critical value approach.

MATLAB: An Introduction with Applications
6th Edition
ISBN:9781119256830
Author:Amos Gilat
Publisher:Amos Gilat
Chapter1: Starting With Matlab
Section: Chapter Questions
Problem 1P

Related questions
Question
A sample of 15 items provides a sample standard deviation of 7.3. Test the following hypotheses using alpha=.05. What is your conclusion? Use both the p-value approach and the critical value approach.
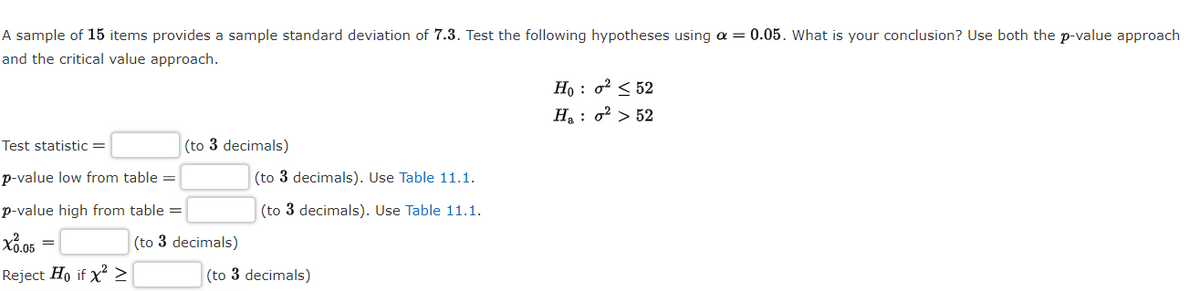
Transcribed Image Text:A sample of 15 items provides a sample standard deviation of 7.3. Test the following hypotheses using a = 0.05. What is your conclusion? Use both the p-value approach
and the critical value approach.
H, : o? < 52
H: o² > 52
Test statistic =
(to 3 decimals)
p-value low from table =
(to 3 decimals). Use Table 11.1.
p-value high from table =
(to 3 decimals). Use Table 11.1.
(to 3 decimals)
Reject Ho if x >
(to 3 decimals)
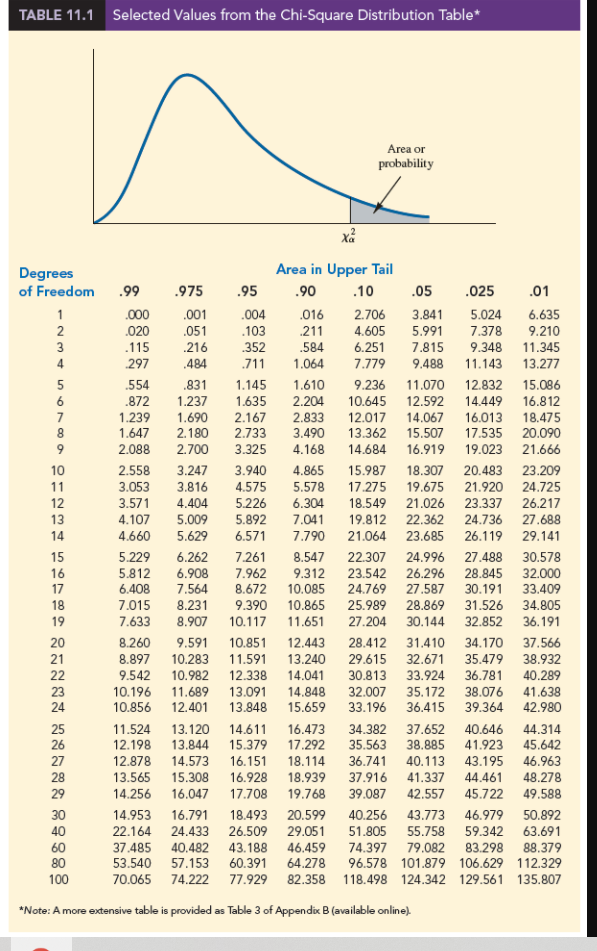
Transcribed Image Text:TABLE 11.1 Selected Values from the Chi-Square Distribution Table*
Area or
probability
xả
Degrees
Area in Upper Tail
of Freedom .99
.975
.95
.90
.10
.05
.025
.01
5.024
7.378
.000
.001
.016
2.706
3.841
6.635
9.210
.004
5.991
7.815
2
.020
.051
.103
.211
4.605
3
.115
.216
352
.584
6.251
9.348
11.345
4
297
.484
.711
1.064
7.779
9.488
11.143
13.277
.554
.831
1.145
1.610
9.236
11.070
12.832
15.086
.872
1.237
1.635
2.204
10.645
12.592
14.449
16.812
7
1.239
1.690
2.167
2.833
12.017
14.067
16.013
18.475
1.647
2.180
2.733
3.490
13.362
15.507
17.535
20.090
9
2.088
2.700
3.325
4.168
14.684
16.919
19.023
21.666
3.940
4.575
10
2.558
3.247
4.865
15.987
18.307
20.483
23.209
3.816
4.404
5.009
5.629
11
3.053
5.578
17.275
19.675
21.920
24.725
12
3.571
5.226
6.304
18.549
21.026
23.337
26.217
13
4.107
5.892
7.041
7.790
19.812
22.362
24.736
27.688
14
4.660
6.571
21.064
23.685
26.119
29.141
15
5.229
6.262
7.261
8.547
22.307
24.996
27.488
30.578
16
5.812
6.908
9.312
7.962
8.672
23.542
24.769
26.296
28.845
32.000
7.564
27.587
28.869
17
6.408
10.085
30.191
33.409
18
7.015
8.231
34.805
9.390
10.117
10.865
25.989
31.526
19
7.633
8.907
11.651
27.204
30.144
32.852
36.191
20
8.260
9.591
10.851
12.443
28.412
31.410
34.170
37.566
21
8.897
10.283
11.591
13.240
29.615
32.671
35.479
38.932
22
9.542
10.982
12.338
14.041
30.813
33.924
36.781
40.289
32.007
23
24
10.196
10.856
11.689
13.091
13.848
14.848
15.659
35.172 38.076
36.415 39.364
41.638
42.980
12.401
33.196
34.382
35.563
25
11.524
13.120
14.611
16.473
37.652
40.646
44.314
26
12.198
13.844
15.379
17.292
38.885
41.923
45.642
27
12.878
14.573
16.151
18.114
36.741
40.113
43.195
46.963
28
13.565
15.308
16.928
18.939
37.916
41.337
44.461
45.722
48.278
29
14.256
16.047
17.708
19.768
39.087
42.557
49.588
20.599
29.051
46.459
30
14.953
16.791
18.493
40.256
43.773 46.979
50.892
40
22.164
24.433
26.509
51.805
55.758
59.342
63.691
40.482
74.397
79.082 83.298
60
80
37.485
53.540
43.188
60.391
88.379
96.578 101.879 106.629 112.329
57.153
64.278
100
70.065 74.222
77.929
82.358 118.498 124.342 129.561 135.807
*Note: A more extensive table is provided as Table 3 of Appendix B (available online).
Expert Solution
This question has been solved!
Explore an expertly crafted, step-by-step solution for a thorough understanding of key concepts.

This is a popular solution!

Trending now
This is a popular solution!

Step by step
Solved in 2 steps with 2 images

Recommended textbooks for you
MATLAB: An Introduction with Applications
Statistics
ISBN:
9781119256830
Author:
Amos Gilat
Publisher:
John Wiley & Sons Inc

Probability and Statistics for Engineering and th…
Statistics
ISBN:
9781305251809
Author:
Jay L. Devore
Publisher:
Cengage Learning

Statistics for The Behavioral Sciences (MindTap C…
Statistics
ISBN:
9781305504912
Author:
Frederick J Gravetter, Larry B. Wallnau
Publisher:
Cengage Learning
MATLAB: An Introduction with Applications
Statistics
ISBN:
9781119256830
Author:
Amos Gilat
Publisher:
John Wiley & Sons Inc
Probability and Statistics for Engineering and th…
Statistics
ISBN:
9781305251809
Author:
Jay L. Devore
Publisher:
Cengage Learning
Statistics for The Behavioral Sciences (MindTap C…
Statistics
ISBN:
9781305504912
Author:
Frederick J Gravetter, Larry B. Wallnau
Publisher:
Cengage Learning

Elementary Statistics: Picturing the World (7th E…
Statistics
ISBN:
9780134683416
Author:
Ron Larson, Betsy Farber
Publisher:
PEARSON

The Basic Practice of Statistics
Statistics
ISBN:
9781319042578
Author:
David S. Moore, William I. Notz, Michael A. Fligner
Publisher:
W. H. Freeman

Introduction to the Practice of Statistics
Statistics
ISBN:
9781319013387
Author:
David S. Moore, George P. McCabe, Bruce A. Craig
Publisher:
W. H. Freeman