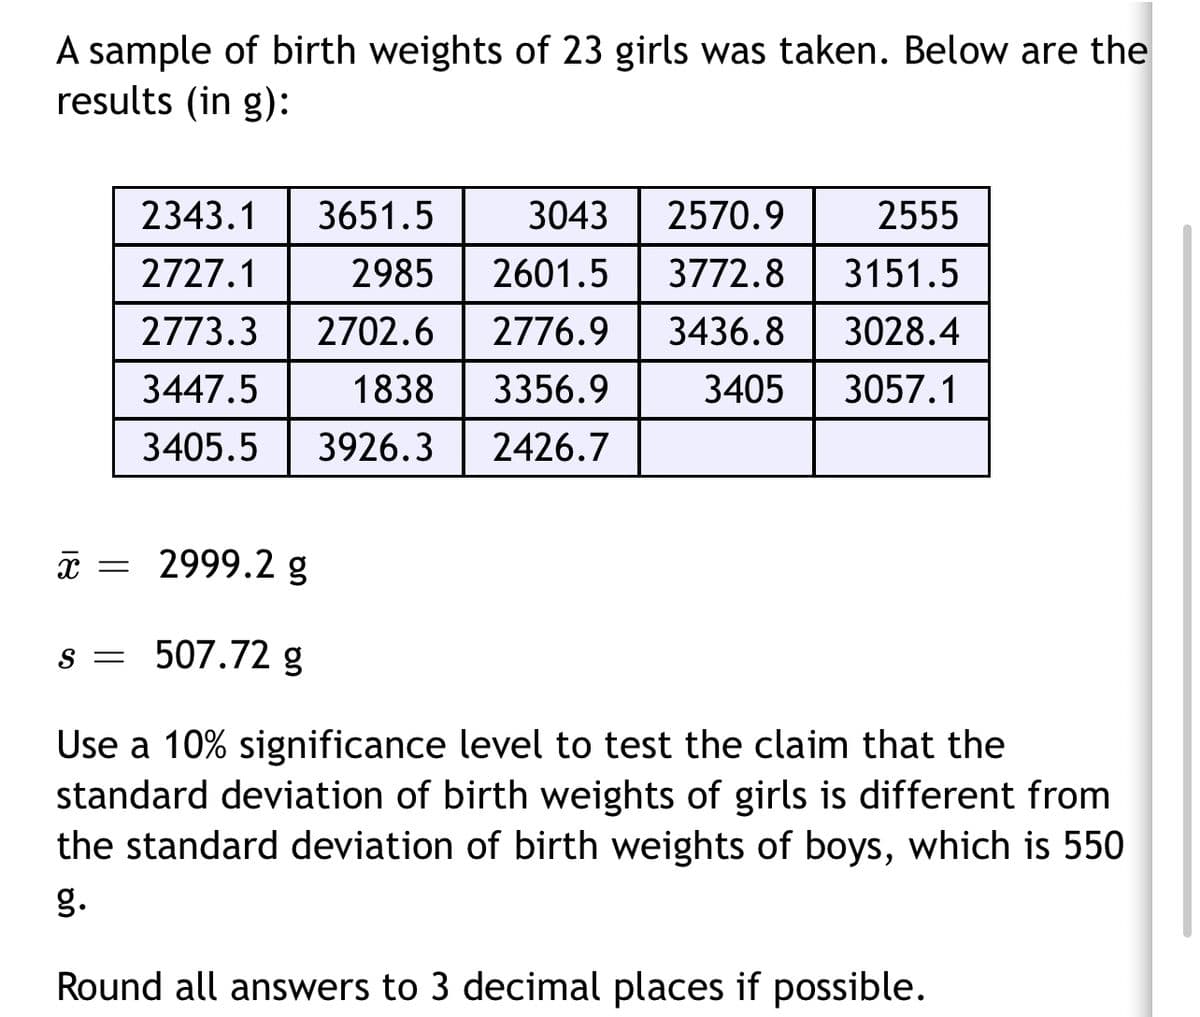
A sample of birth weights of 23 girls was taken. Below are the results (in g): 2343.1 3651.5 3043 2570.9 2555 2727.1 2985 2601.5 3772.8 3151.5 2773.3 2702.6 2776.9 3436.8 3028.4 3447.5 1838 3356.9 3405 3057.1 3405.5 3926.3 2426.7
A sample of birth weights of 23 girls was taken. Below are the results (in g): 2343.1 3651.5 3043 2570.9 2555 2727.1 2985 2601.5 3772.8 3151.5 2773.3 2702.6 2776.9 3436.8 3028.4 3447.5 1838 3356.9 3405 3057.1 3405.5 3926.3 2426.7

Mathematics For Machine Technology
8th Edition
ISBN:9781337798310
Author:Peterson, John.
Publisher:Peterson, John.
Chapter29: Tolerance, Clearance, And Interference
Section: Chapter Questions
Problem 16A: Spacers are manufactured to the mean dimension and tolerance shown in Figure 29-12. An inspector...

Related questions
Question
Transcribed Image Text:A sample of birth weights of 23 girls was taken. Below are the
results (in g):
2343.1
3651.5
3043
2570.9
2555
2727.1
2985
2601.5
3772.8
3151.5
2773.3
2702.6 | 2776.9
3436.8
3028.4
3447.5
1838
3356.9
3405
3057.1
3405.5
3926.3
2426.7
* = 2999.2g
s = 507.72 g
Use a 10% significance level to test the claim that the
standard deviation of birth weights of girls is different from
the standard deviation of birth weights of boys, which is 550
g.
Round all answers to 3 decimal places if possible.
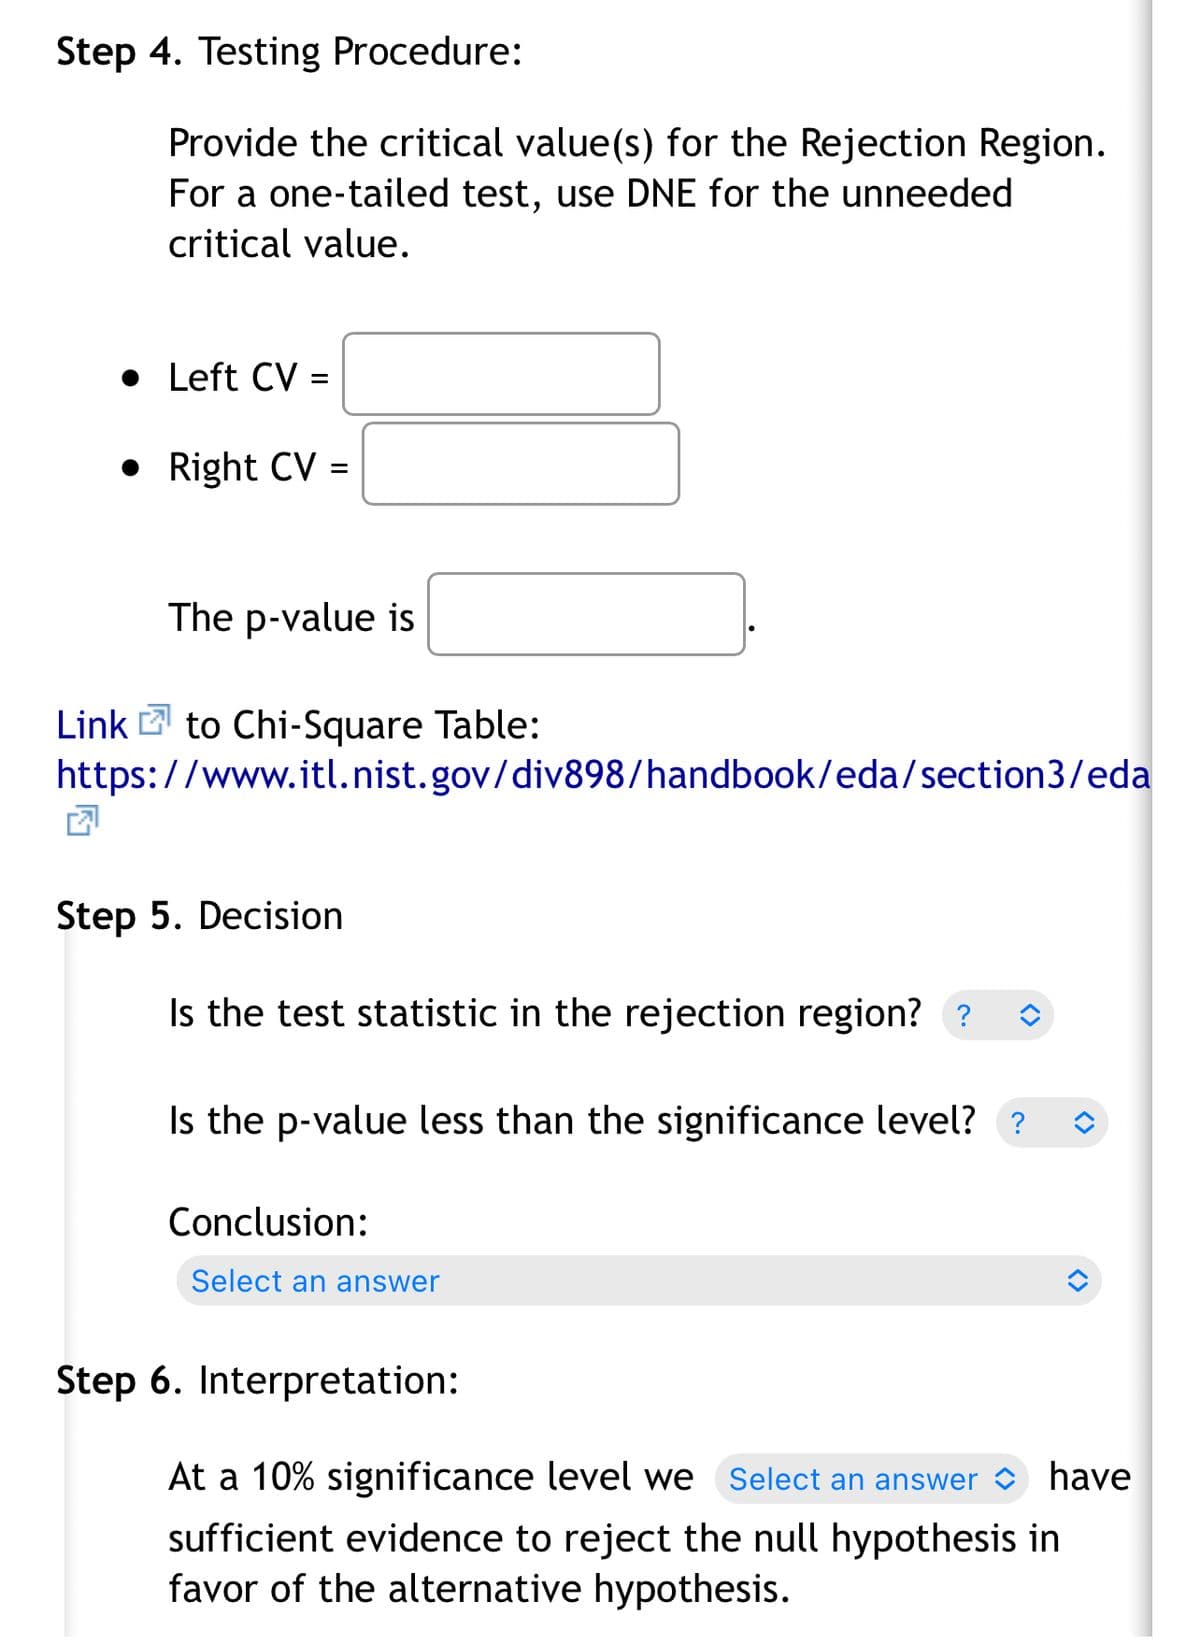
Transcribed Image Text:Step 4. Testing Procedure:
Provide the critical value(s) for the Rejection Region.
For a one-tailed test, use DNE for the unneeded
critical value.
• Left CV =
• Right CV =
The p-value is
Link 2 to Chi-Square Table:
https://www.itl.nist.gov/div898/handbook/eda/section3/eda
Step 5. Decision
Is the test statistic in the rejection region? ?
Is the p-value less than the significance level? ?
Conclusion:
Select an answer
Step 6. Interpretation:
At a 10% significance level we Select an answer have
sufficient evidence to reject the null hypothesis in
favor of the alternative hypothesis.
Expert Solution
This question has been solved!
Explore an expertly crafted, step-by-step solution for a thorough understanding of key concepts.

This is a popular solution!

Trending now
This is a popular solution!

Step by step
Solved in 4 steps with 2 images

Recommended textbooks for you
Mathematics For Machine Technology
Advanced Math
ISBN:
9781337798310
Author:
Peterson, John.
Publisher:
Cengage Learning,
Mathematics For Machine Technology
Advanced Math
ISBN:
9781337798310
Author:
Peterson, John.
Publisher:
Cengage Learning,