A scientist drew a line graph of the average annual temperature in the United States between 1953 and 1962. 53.5- 53 52.5 52 51.5- 51 50.5 50 1952 1954 1956 1958 1960 1962 Year 0 2020 StrongMind. Created using GeoGebra. Between which two years did the average annual temperature increase the most? O between 1959 and 1960 O between 1955 and 1956 O between 1956 and 1957 between 1960 and 1961 Temperature (Fahrenheit)
A scientist drew a line graph of the average annual temperature in the United States between 1953 and 1962. 53.5- 53 52.5 52 51.5- 51 50.5 50 1952 1954 1956 1958 1960 1962 Year 0 2020 StrongMind. Created using GeoGebra. Between which two years did the average annual temperature increase the most? O between 1959 and 1960 O between 1955 and 1956 O between 1956 and 1957 between 1960 and 1961 Temperature (Fahrenheit)

Algebra and Trigonometry (6th Edition)
6th Edition
ISBN:9780134463216
Author:Robert F. Blitzer
Publisher:Robert F. Blitzer
ChapterP: Prerequisites: Fundamental Concepts Of Algebra
Section: Chapter Questions
Problem 1MCCP: In Exercises 1-25, simplify the given expression or perform the indicated operation (and simplify,...

Related questions
Question
can you answer these two please
Transcribed Image Text:primaverahs.strongmind.com
O StrongMind
O Unit 4 Exam
Unit 4 - G...
L Desmos |...
G Why migh.
b Search re...
Vocab Sh...
U4 exam...
Unit 4 Exa...
Checkpoi...
18 Flashc...
Home
Announcements
Discussions
Grades 5
Syllabus
Conferences
Modules
StrongMinded
Course Evaluation
12 of 20
Question 11
Listen
Question 12
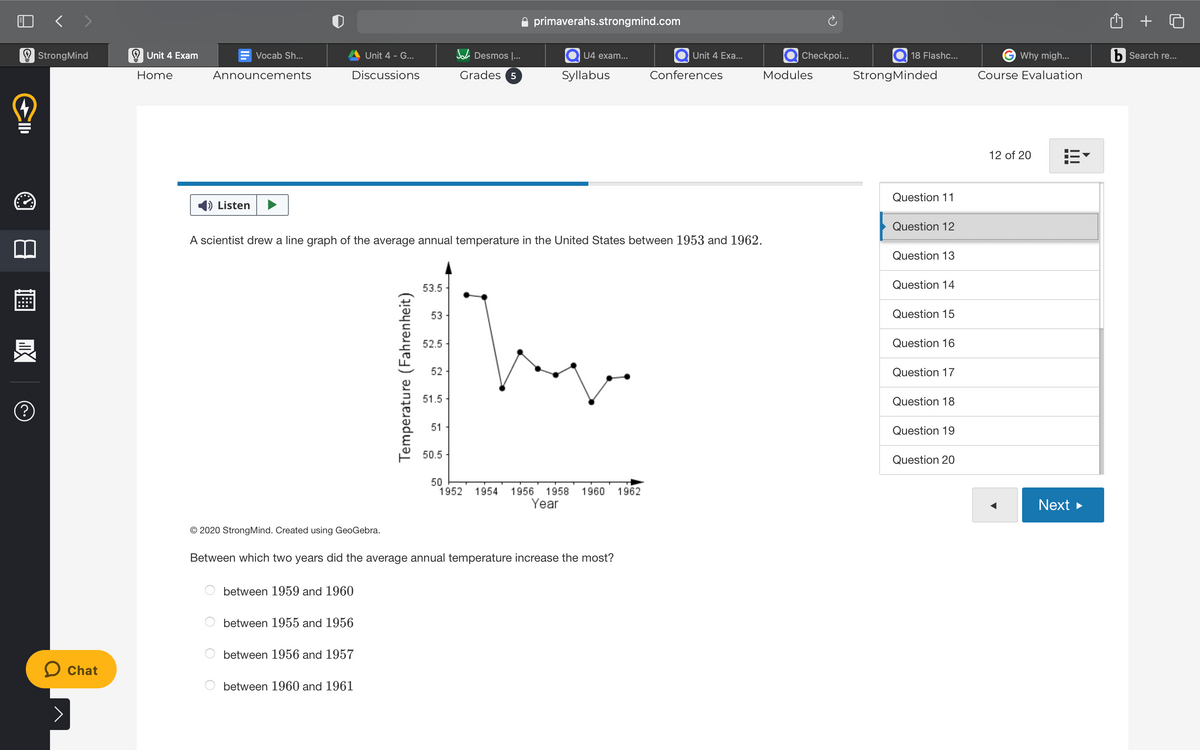
A scientist drew a line graph of the average annual temperature in the United States between 1953 and 1962.
Question 13
53.5
Question 14
53
Question 15
52.5
Question 16
52
Question 17
51.5
Question 18
(?
51
Question 19
50.5
Question 20
50
1952
1954
1956
1958
1960
1962
Year
Next >
© 2020 StrongMind. Created using GeoGebra.
Between which two years did the average annual temperature increase the most?
between 1959 and 1960
between 1955 and 1956
between 1956 and 1957
O Chat
between 1960 and 1961
II
Temperature (Fahrenheit)
O O
Transcribed Image Text:primaverahs.strongmind.com
O StrongMind
O Unit 4 Exam
Unit 4 - G...
L Desmos |...
G Why migh.
b Search re...
Vocab Sh...
U4 exam...
Unit 4 Exa...
Checkpoi...
18 Flashc...
Home
Announcements
Discussions
Grades 5
Syllabus
Conferences
Modules
StrongMinded
Course Evaluation
11 of 20
Question 11
Listen
Question 12
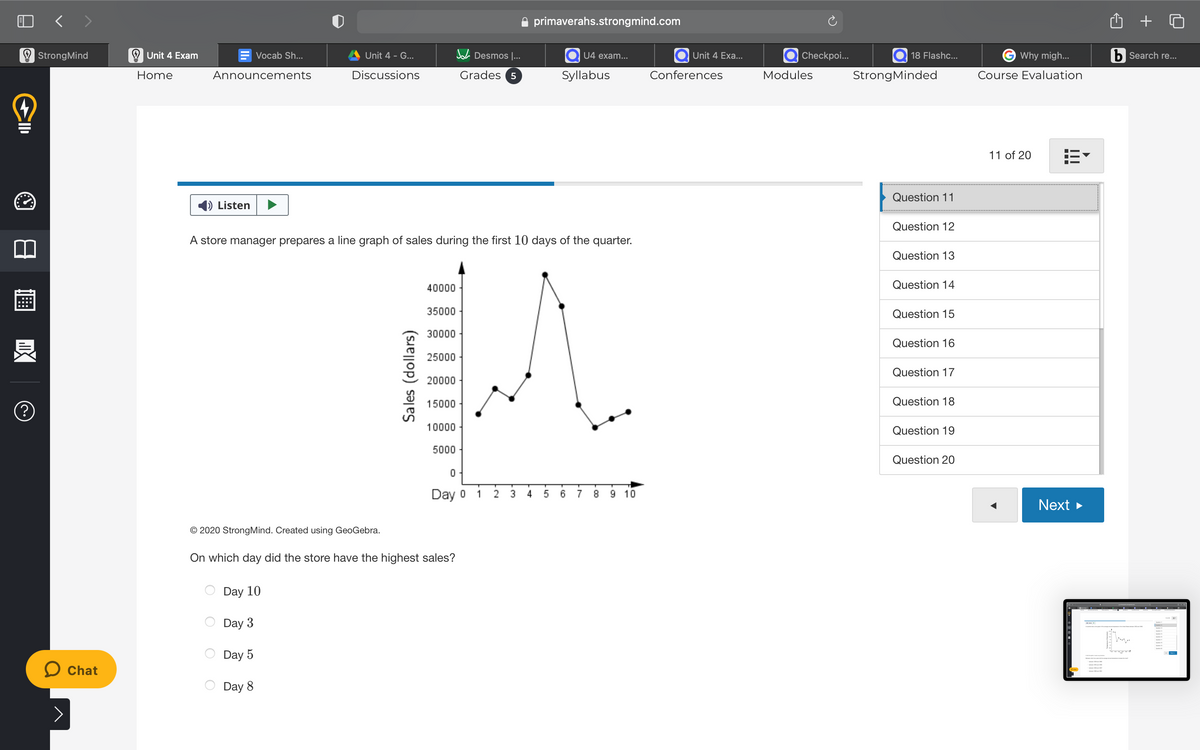
A store manager prepares a line graph of sales during the first 10 days of the quarter.
Question 13
40000
Question 14
35000
Question 15
30000
Question 16
25000
Question 17
20000
15000
Question 18
(?
10000
Question 19
5000
Question 20
Day o
2
3
7
9 10
1
4
6
8
Next >
© 2020 StrongMind. Created using GeoGebra.
On which day did the store have the highest sales?
Day 10
Day 3
Day 5
O Chat
Day 8
Sales (dollars)
LO
Expert Solution
This question has been solved!
Explore an expertly crafted, step-by-step solution for a thorough understanding of key concepts.

This is a popular solution!

Trending now
This is a popular solution!

Step by step
Solved in 2 steps with 1 images

Recommended textbooks for you
Algebra and Trigonometry (6th Edition)
Algebra
ISBN:
9780134463216
Author:
Robert F. Blitzer
Publisher:
PEARSON

Contemporary Abstract Algebra
Algebra
ISBN:
9781305657960
Author:
Joseph Gallian
Publisher:
Cengage Learning

Linear Algebra: A Modern Introduction
Algebra
ISBN:
9781285463247
Author:
David Poole
Publisher:
Cengage Learning
Algebra and Trigonometry (6th Edition)
Algebra
ISBN:
9780134463216
Author:
Robert F. Blitzer
Publisher:
PEARSON
Contemporary Abstract Algebra
Algebra
ISBN:
9781305657960
Author:
Joseph Gallian
Publisher:
Cengage Learning
Linear Algebra: A Modern Introduction
Algebra
ISBN:
9781285463247
Author:
David Poole
Publisher:
Cengage Learning

Algebra And Trigonometry (11th Edition)
Algebra
ISBN:
9780135163078
Author:
Michael Sullivan
Publisher:
PEARSON

Introduction to Linear Algebra, Fifth Edition
Algebra
ISBN:
9780980232776
Author:
Gilbert Strang
Publisher:
Wellesley-Cambridge Press

College Algebra (Collegiate Math)
Algebra
ISBN:
9780077836344
Author:
Julie Miller, Donna Gerken
Publisher:
McGraw-Hill Education