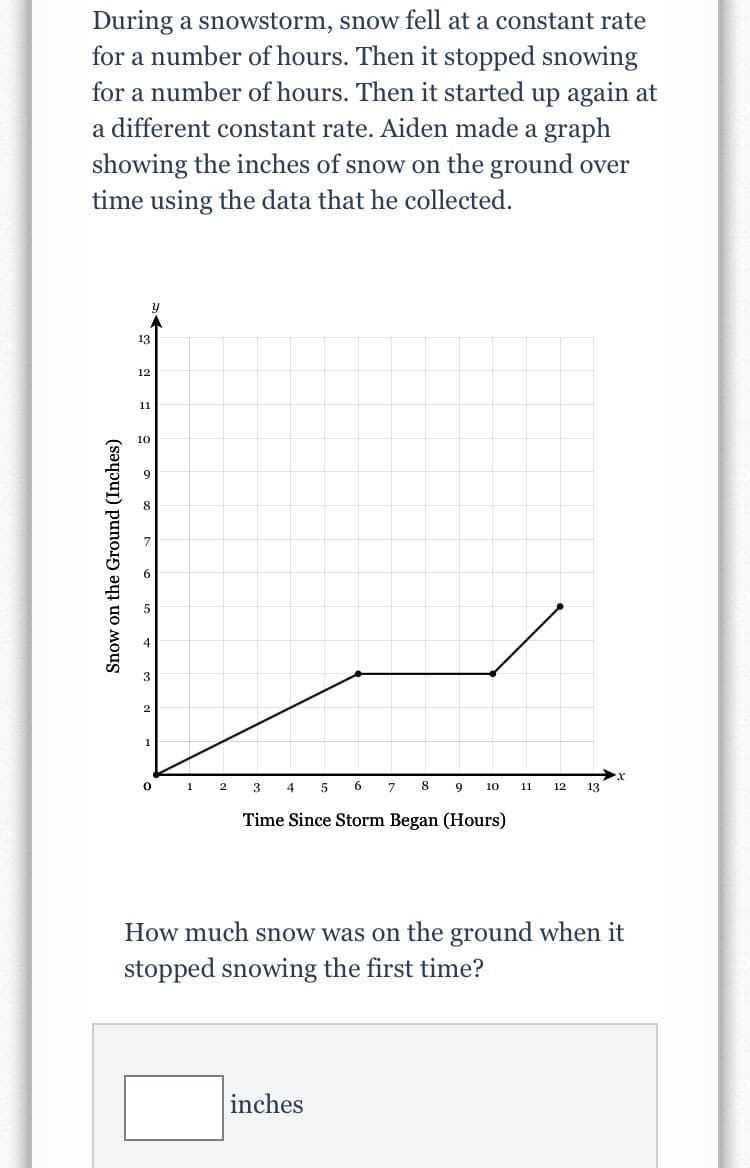
During a snowstorm, snow fell at a constant rate for a number of hours. Then it stopped snowing for a number of hours. Then it started up again at a different constant rate. Aiden made a graph showing the inches of snow on the ground over time using the data that he collected. 13 12 11 10 9. 8. 7 6. 2 3 4 5 6 7 8. 9 10 11 12 13 Time Since Storm Began (Hours) 2. 3. 1. Snow on the Ground (Inches)
During a snowstorm, snow fell at a constant rate for a number of hours. Then it stopped snowing for a number of hours. Then it started up again at a different constant rate. Aiden made a graph showing the inches of snow on the ground over time using the data that he collected. 13 12 11 10 9. 8. 7 6. 2 3 4 5 6 7 8. 9 10 11 12 13 Time Since Storm Began (Hours) 2. 3. 1. Snow on the Ground (Inches)

Algebra & Trigonometry with Analytic Geometry
13th Edition
ISBN:9781133382119
Author:Swokowski
Publisher:Swokowski
Chapter5: Inverse, Exponential, And Logarithmic Functions
Section5.3: The Natural Exponential Function
Problem 23E

Related questions
Question
100%
Transcribed Image Text:During a snowstorm, snow fell at a constant rate
for a number of hours. Then it stopped snowing
for a number of hours. Then it started up again at
a different constant rate. Aiden made a graph
showing the inches of snow on the ground over
time using the data that he collected.
13
12
11
10
1
3
4
5
6
7
8
10
11
12
13
Time Since Storm Began (Hours)
How much snow was on the ground when it
stopped snowing the first time?
inches
Snow on the Ground (Inches)
Expert Solution
This question has been solved!
Explore an expertly crafted, step-by-step solution for a thorough understanding of key concepts.

This is a popular solution!

Trending now
This is a popular solution!

Step by step
Solved in 2 steps

Recommended textbooks for you
Algebra & Trigonometry with Analytic Geometry
Algebra
ISBN:
9781133382119
Author:
Swokowski
Publisher:
Cengage

Functions and Change: A Modeling Approach to Coll…
Algebra
ISBN:
9781337111348
Author:
Bruce Crauder, Benny Evans, Alan Noell
Publisher:
Cengage Learning
Algebra & Trigonometry with Analytic Geometry
Algebra
ISBN:
9781133382119
Author:
Swokowski
Publisher:
Cengage
Functions and Change: A Modeling Approach to Coll…
Algebra
ISBN:
9781337111348
Author:
Bruce Crauder, Benny Evans, Alan Noell
Publisher:
Cengage Learning