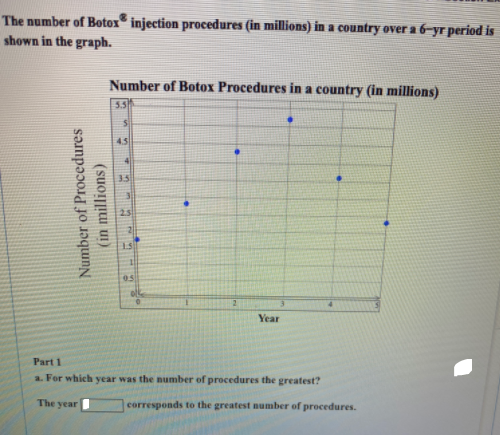
The number of Botox injection procedures (in millions) in a country over a 6-yr period is shown in the graph. Number of Botox Procedures in a country (in millions) 5.5 4.5 3.5 25 15 05 Year Part 1 a. For which year was the number of procedures the greatest? The year corresponds to the greatest number of procedures. Number of Procedures (in millions)


Q: Time between Eruptions of Old Faithful (n-222) 100 80 60 40- 20- 45 54 63 72 81 90 99 Time between…
A: We have to analyze the given graph and tell how we can improve it.
Q: Salaries ($) The graph to the right compares teaching salaries of women and men at private colleges…
A: What impression does the graph creates. Answer : B. The graph creates the impression that men have…
Q: A driver’s age has something to do with his or her chance of getting into a fatal car crash. The bar…
A: Given that, The number of fatal vehicle crashes per 100 million miles, y, for drivers of age x can…
Q: Reshaping the Labor Force. The following graph is based on one that appeared in an Arizona Republic…
A:
Q: Casey ran a 75-meter race in 10 seconds. Here is a graph of some selected data from her race. To…
A: Given that, Casey ran a 75 meter race in 10 seconds and its corresponding graph is also given.
Q: During a snowstorm, Kevin tracked the amount of snow on the ground. When the storm began, there was…
A:
Q: C. Interpret the given the graph below. Enrolment for Schools A and B for the past four years 600…
A: Given: Graph of enrollment for schools A and B for past four years is shown below: To find: a) In…
Q: The number of Botor injection procedures (in millions) in a country over a-yr period shown in the…
A:
Q: When visiting his parents, Tyler drives at an average speed of 42 km/h through urban areas and at an…
A:
Q: A graph displaying the relationship between the value of a stock and time is shown below. Jurwy…
A:
Q: True or false and why In a position-time graph, the slop of the line represents total distance…
A: Given data is : Why In a position-time graph, the slop of the line represents total distance…
Q: A model for the men’s 100-meter freestyle record times in seconds is given by y = (38,504.4888 +…
A:
Q: The human immunodeficiency virus, or HIV, infects and kills helper T cells. Because T cells…
A: a) From the graph at x=5 we have y=400 So, f(5)=400 Answer(a): 400
Q: 1) Kina's office has two printers. The rate at which the first printer prints is shown in the table…
A: Given data: The number of pages prints at t=0 is p0=0. The number of pages prints at t=4 minutes is…
Q: dasticity or draw a graph illustrating these.
A: Simply put, homoscedasticity means “having the same scatter.” For it to exist in a set of data, the…
Q: a) Construct a graph of the data including setting up the axes scales, axes labeling, plotting the…
A: Given data: Developing country: YEAR Population…
Q: You find a rare comic book at a yard sale and determine that the price of the comic book, y,…
A:
Q: Basel's weather app shows a diagram of the predicted weather and maximum temperatures for the next…
A:
Q: A driver’s age has something to do with his or her chance of getting into a fatal car crash. The bar…
A: The number of fatal vehicle crashes per 100 million miles, y, for drivers of age x can be modeled by…
Q: An aquarium b being filed with water. The graph shows the belght of the water over time as the…
A: from given graph height and time are related by linear relationship
Q: A drug has a half-life of 12 hours in the human bloodstream. The dosage is 31 milligrams per day.…
A: Graph
Q: The graphs show the percentage of jobs in the U.S. labor force held by men and by women from 1970…
A: From the graph we can see that the percentage of jobs in the U.S. labor force held by women in 2010…
Q: 3. One of the ways society is trying to bring the pandemic under control is by vaccinating people…
A:
Q: The graph to the right compares teaching salanes and men at private colleges and universities. What…
A: Given information: No. of variable=2 Variable of interest=Salaries of employees
Q: sedentary lifestyles. According to the model, how many calories per day are needed by females…
A: We have given the bar graph that shows the estimated number of calories per day needed to maintain…
Q: Voluntary Response Data If we have a large voluntary response sample consisting of weights of…
A: Voluntary response sampling:In this type of sampling the subjects or the respondents voluntarily…
Q: 6. The table below shows last semester’s cumulative scores for the seven students sitting closest to…
A: Given Information: Consider the provided table that shows the cumulative scores of the students who…
Q: Rosetta Stone II: Graph, "Compared with drivers who have not had any alcohol, the risk of a crash…
A: To draw a graph of the given data, first we create data table for the given question. Class…
Q: The graph shows the number of deaths in the United States due to accidents. Answer the following…
A: Given graph shows the number of deaths in the US due to accidents.
Q: Salaries ($) The graph to the right compares teaching salaries of women and men at private colleges…
A: The graph shows the teaching salaries of women and men at private colleges and universities.
Q: The Effect of Relaxation Training on Anxiety Scores Group Mean Anxiety Score SE Control group…
A: Given Group mean anxiety Score SE Control group 36 7 Relaxation training 18 5
Q: 11 Greg walked to the store and then returned home. This graph shows the distance Greg was from his…
A:
Q: The coaches of a group of debate teams answered a survey about hours of debate and number of team…
A: Given the scatter plot, This plot represents a positive correlation.
Q: This question: point(s) possible The graph to the right shows the number of snow shovels sold in…
A: From the above we have,
Q: 4. The table and graph below show the relationship between the numbers of flowers Zane grows and the…
A: On x-axis, we have number of seed packets used. On y-axis, we have number of flowers grown.
Q: Tollowing graph Cape Epic mountain bike tour race. Use the graph below to answer the questions. ABSA…
A: 2.1 To determine: Total amount cycled over stages 4 to 7. In stage 4 Distance travelled = 112 In…
Q: avings ($) 31 REE 2.6 Haruki has $20 in his savings account. He adds $5 each week to the account. He…
A:
Q: Salaries ($) The graph to the right compares teaching salaries of women and men at private colleges…
A: Given data: The graph to the right compares teaching salaries of women and men at private colleges…
Q: Between 1980 and 2012, the number of adults in a certain country who were overweight more than…
A: Given: The number of adults who were overweight more than doubled from 17% to 36%.
Q: 80 75 70 65 60 55 50 Year Ms. Fremont recorded the number of potatoes that she grew in her garden…
A:
Q: Do women feel differently from men when it comes to tax rates? One question on a survey of randomly…
A: The following data is given, Female tax rate Male tax rate 10 15 10 20 4 10 23 10 21 17…
Q: The percentage of a certain country's national income generated by nonfarm proprietors may be…
A: The percentage of certain country's national income generated by nonfarm properties is modeled by…
Q: What impression does the graph create? O A. The graph creates the impression that men and women have…
A: Solution: a) b)
Q: he line graph shows the number of awakenings during the night for a particular group of people. Use…
A: from the graph we can see that
Q: 1. The graph represents the level of happiness at different times of day. Use the graph to answer…
A: Due to Bartleby guidelines, only 3 sub parts can be solved. Please repost the remaining questions to…
Q: A researcher evaluated the effectiveness of relaxation training in reducing anxiety. One sample of…
A: Given information: A researcher is interested in evaluating the effectiveness of relaxation training…
Q: A model for the men’s 100-meter freestyle record times in seconds is given by y=(38,504.4888 +…
A: Given that, A model for the men’s 100-meter freestyle record times in seconds is given by…
Q: 2. This graph shows how the number of trees in a town decreased as new subdivisions were developed,…
A: The graphs can be used to explain situations. The graph are drawn from the functions. The curve…


Trending now
This is a popular solution!

Step by step
Solved in 3 steps

- - The management has decided to hire a new marketing director. Based on the table given and the prices staying the same, the volume of sales and the revenue show a decreasing trend. -The interview process requires the candidate to design a plan that will increase the revenue for the following year during the first 3 months. Each monthly revenue should increase by $1,000. The price for each type of fruit should not be increased by more than one dollar. One candidate offers the option to increase the sales amounts in hundreds to the values below. Is this an acceptable opyion? Will the candidate get the job? Sales in Hundreds April May June Stawberries 9 8 6 Apples 10 9 8 Pineapples 6 9 5 Monthly revenue in hundredsThe time it takes an employee to package the components of a certain product is normally distributed with μ = 7.5 and σ = 2.5 minutes. As an incentive, management has decided to give a bonus to the 20% of employees who took the shortest amount of time to package the components. Find the amount of time taken to package the components that will indicate that an employee should get a bonus. (Round your answer to two decimal places.) An employee must package components in a time ---Select--- more than less than minutes.Using the equation from line of best fit estimate the youngest age to be to have a 4.0 Line of best fit equation Y= 0.019084x+3.97814
- An economist wants to compare the economic growth rate (%) within 50 kilometers and 100 kilometers to cities in a country. He collected 6 cities of the country, and calculated the growth rates with 50km and 100km as shown in the following table. Choose an appropriate test to validate that regions within 100km have higher economic growth rate than the regions within 50km to cities. You can make certain assumptions, but need to write to indicate your assumption. Show calculations by hand.Life Span On the basis of data and projections for theyears 1910 through 2020 the expected life span ofpeople in the United States can be described by thefunction f (x) = 11.027 + 14.304 ln x years, wherex is the number of years from 1900 to the person’sbirth year.a. What does this model estimate the life span to befor people born in 1925? In 2007? (Give eachanswer to the nearest year.)b. Explain why these numbers are so different.A gardener applied chemical "Z" to plants in a flower bed. (S)he observed that the plants grew dramatically during the next two weeks. Using only the information from the previous two sentences, write a hypothesis about the effect of chemical "Z" on plants. (Note: Your hypothesis must be a testable statement.) A researcher conducted a series of experiments to test the effect of chemical “Z” on plants. The data from the experiments is summarized in the graph below. (Image of the Graph attached.) Interpret the graph above. What did the researcher learn about the effect of chemical “Z?” Based on the researcher’s graph, what can you conclude about the hypothesis you wrote for Question 7 above?
- Determine the two values of such that the middle 55% of the data lie between the two -values. Round the solutions to two decimal places, as -values are traditionally rounded. The middle 55% of the data lie between Incorrect and Incorrect . Hint: Due to symmetry, the two -values should be opposites. Also, enter the smaller -value in the first blank and the larger -value in the second blank.Q9: Assume that a researcher wants to estimate the proportion of “A” grade scorers in STAT101 course for the population of SEU students in 2020. Assume also that the proportion of “A” grade scorers in 2020 is not known. How many SEU students must be surveyed from STAT101 course in order to be 90% confident and the margin of error should not exceed two percentage points? (Given zα/2 = 1.64). 1- 1821 2- 1781 3- 1618 4- 1681A company wants to plan production for the ensuing year so as to minimize thecombined cost of production and inventory storage. In each quarter of the year, demand isanticipated to be 65, 80, 135 and 75 respectively. The product can be manufactured duringregular time at a cost of Php 16 per unit produced, or during overtime at a cost of Php 20 perunit. The given table below shows data pertinent to production capacities. The cost of carryingone unit in inventory per quarter is Php 2. The inventory level at the beginning of the firstquarter is zero.
- Due to a stocking error 50 carp are added to a lake. The carp are prolific breeders with a population growth rate coefficient of 0.5 per month. Lake managers catch and remove K carp per month. What is the minimum number of carp that must be captured and removed to ensure they are eventually eradicated?The success of a project depends on the effort level of a worker. In case of successthe revenues will be 400,000 TL whereas in case of no-success the revenues will be 0. The workercan provide a low effort level or a high effort level. The effort level cannot be observed by theprincipal. The worker requires an expected salary of 60,000 TL to provide the low effort leveland an expected salary of 80,000 TL to provide the high effort level. The success probabilitiesfor the project are 40% in case of low effort level and 80% in case of high effort level. Whatshould be the minimum bonus (that is awarded in addition to the base salary in case of success)and the base salary for the worker so that the worker has the incentives to provide the higheffort level?Ballistics Ballistics experts are able to identify theweapon that fired a certain bullet by studying the markings on the bullet after it is fired. They test the rifling(the grooves in the bullet as it travels down the barrelof the gun) by comparing it to that of a second bulletfired into a bale of paper. The speed, s, in centimeters per second, that the bullet travels through the paper isgiven by s = 3013 - 10t2 3, where t is the time afterthe bullet strikes the bale and t … 0.3 second.a. Complete the following table to find the speed forgiven values of t. b. Use the root method to find the number of secondsto give s = 0. Does this agree with the data in thetable?
