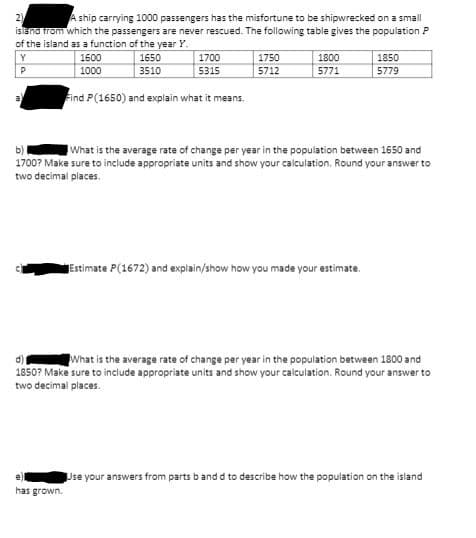
A ship carrying 1000 passengers has the misfortune to be shipwrecked on a small islana trom which the passengers are never rescued. The following table gives the population P of the island as a function of the year Y. 1600 1000 1800 5771 1650 1700 1750 1850 5779 3510 5315 5712 ind P(1650) and explain what it means. What is the average rate of change per year in the population between 1650 and 17007 Make sure to include appropriate units and show your calculation. Round your answer to two decimal places. Estimate P(1672) and explain/show how you made your estimate. What is the average rate of change per year in the population between 1800 and 1850? Make sure to include appropriate units and show your calculation. Round your answer to two decimal places. Use your answers from parts b and d to describe how the population on the island has grown.
A ship carrying 1000 passengers has the misfortune to be shipwrecked on a small islana trom which the passengers are never rescued. The following table gives the population P of the island as a function of the year Y. 1600 1000 1800 5771 1650 1700 1750 1850 5779 3510 5315 5712 ind P(1650) and explain what it means. What is the average rate of change per year in the population between 1650 and 17007 Make sure to include appropriate units and show your calculation. Round your answer to two decimal places. Estimate P(1672) and explain/show how you made your estimate. What is the average rate of change per year in the population between 1800 and 1850? Make sure to include appropriate units and show your calculation. Round your answer to two decimal places. Use your answers from parts b and d to describe how the population on the island has grown.

Chapter6: Exponential And Logarithmic Functions
Section6.8: Fitting Exponential Models To Data
Problem 3TI: Table 6 shows the population, in thousands, of harbor seals in the Wadden Sea over the years 1997 to...

Related questions

Concept explainers
Contingency Table
A contingency table can be defined as the visual representation of the relationship between two or more categorical variables that can be evaluated and registered. It is a categorical version of the scatterplot, which is used to investigate the linear relationship between two variables. A contingency table is indeed a type of frequency distribution table that displays two variables at the same time.
Binomial Distribution
Binomial is an algebraic expression of the sum or the difference of two terms. Before knowing about binomial distribution, we must know about the binomial theorem.
Topic Video
Question
2
Transcribed Image Text:A ship carrying 1000 passengers has the misfortune to be shipwrecked on a small
2
island trom which the passengers are never rescued. The following table gives the population P
of the island as a function of the year Y.
1850
5779
Y
1600
1750
1650
3510
1700
1800
1000
5315
5712
5771
Find P(1650) and explain what it means,
b)
What is the average rate of change per year in the population between 1650 and
1700? Make sure to include appropriate units and show your calculation. Round your answer to
two decimal places.
Estimate P(1672) and explain/show how you made your estimate.
What is the average rate of change per year in the population between 1800 and
1850? Make sure to include appropriate units and show your calculation. Round your answer to
two decimal places.
Use your answers from parts band d to describe how the population on the island
has grown.
Expert Solution
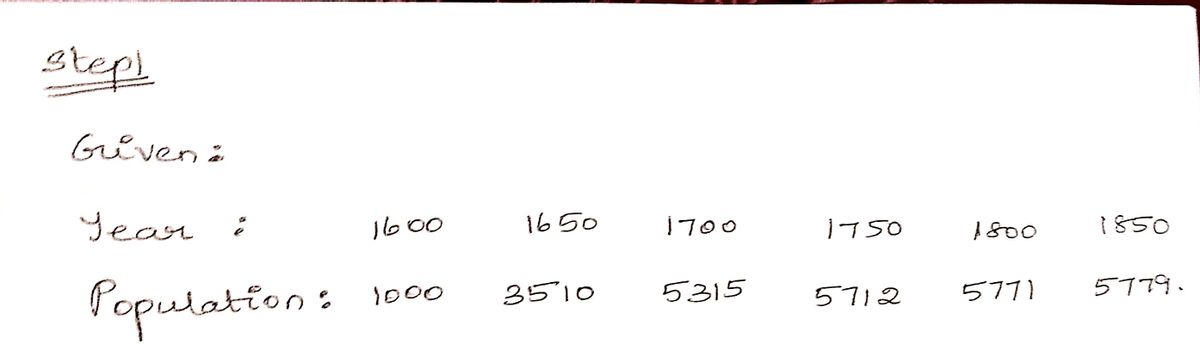
Step 1

Trending now
This is a popular solution!

Step by step
Solved in 5 steps with 5 images

Knowledge Booster


Learn more about
Need a deep-dive on the concept behind this application? Look no further. Learn more about this topic, calculus and related others by exploring similar questions and additional content below.Recommended textbooks for you

College Algebra (MindTap Course List)
Algebra
ISBN:
9781305652231
Author:
R. David Gustafson, Jeff Hughes
Publisher:
Cengage Learning

College Algebra (MindTap Course List)
Algebra
ISBN:
9781305652231
Author:
R. David Gustafson, Jeff Hughes
Publisher:
Cengage Learning

Trigonometry (MindTap Course List)
Trigonometry
ISBN:
9781337278461
Author:
Ron Larson
Publisher:
Cengage Learning

Algebra & Trigonometry with Analytic Geometry
Algebra
ISBN:
9781133382119
Author:
Swokowski
Publisher:
Cengage

Big Ideas Math A Bridge To Success Algebra 1: Stu…
Algebra
ISBN:
9781680331141
Author:
HOUGHTON MIFFLIN HARCOURT
Publisher:
Houghton Mifflin Harcourt