A shoe store developed the following estimated regression equation relating sales to inventory investment and advertising expenditures. i25+10z + 8.r where 1= inventory investment ($1000s) I2 = advertising expenditures ($1000s) y= sales ($1000s) The data used to develop the model came from a survey of 10 stores; for those data, SST = 18,000 and SSR 11,000. a. Compute SSE, MSE, and MSR (to 2 decimals, if necessary). SSE MSE- MSR - b. Use an F test and 0 =0.05 level of significance to determine whether there is a relationship among the variables. Compute F test statistic (to 2 decimals). Use F table. The p-value is Sclect your answer - What is your conclusion? There-Sclect your answer - Va significant relationship attriu LHe variatiles.
A shoe store developed the following estimated regression equation relating sales to inventory investment and advertising expenditures. i25+10z + 8.r where 1= inventory investment ($1000s) I2 = advertising expenditures ($1000s) y= sales ($1000s) The data used to develop the model came from a survey of 10 stores; for those data, SST = 18,000 and SSR 11,000. a. Compute SSE, MSE, and MSR (to 2 decimals, if necessary). SSE MSE- MSR - b. Use an F test and 0 =0.05 level of significance to determine whether there is a relationship among the variables. Compute F test statistic (to 2 decimals). Use F table. The p-value is Sclect your answer - What is your conclusion? There-Sclect your answer - Va significant relationship attriu LHe variatiles.

MATLAB: An Introduction with Applications
6th Edition
ISBN:9781119256830
Author:Amos Gilat
Publisher:Amos Gilat
Chapter1: Starting With Matlab
Section: Chapter Questions
Problem 1P

Related questions
Question
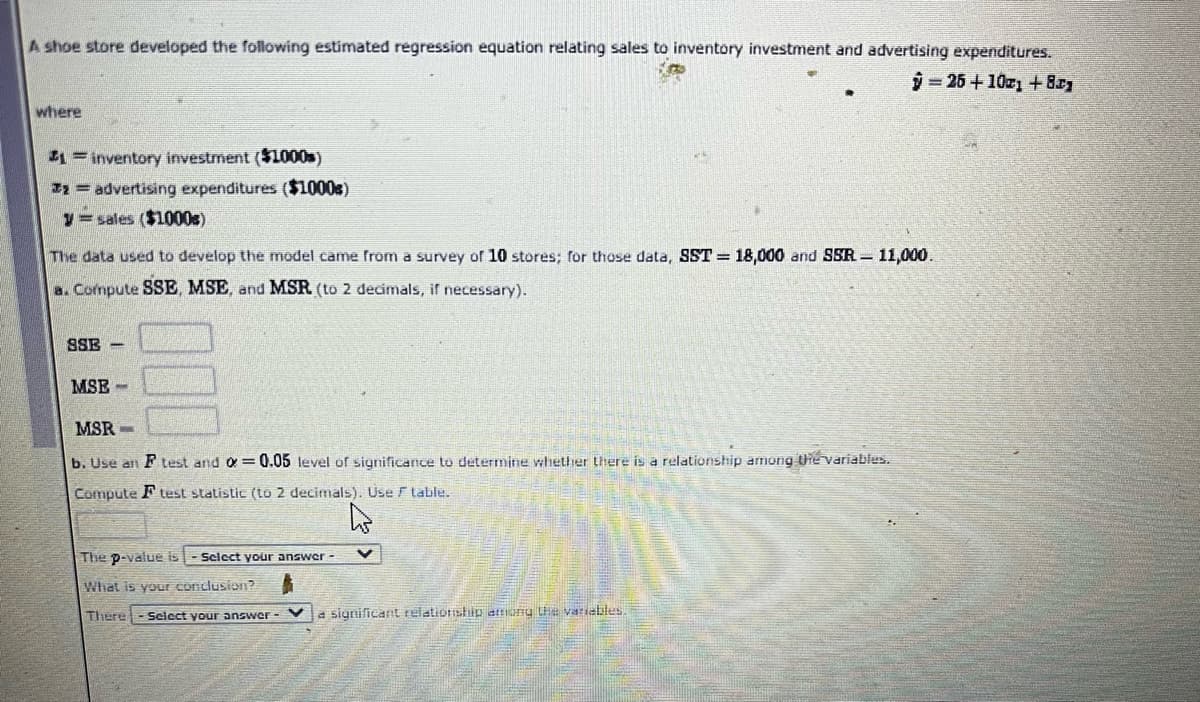
Transcribed Image Text:A shoe store developed the following estimated regression equation relating sales to inventory investment and advertising expenditures.
i25+10z + 8
where
1= inventory investment ($L000s)
I2= advertising expenditures ($1000s)
y= sales ($1000s)
The data used to develop the model came from a survey of 10 stores; for those data, SST= 18,000 and SSR – 11,000.
a. Compute SSE, MSE, and MSR (to 2 decimals, if necessary).
SSE -
MSE -
MSR -
b. Use an F test and o = 0.05 level of
ificance
determine whether there is a relationship among the variables.
Compute F test statistic (to 2 decimals). Use F table.
The p-value is
Scicct your answer -
What is your conclusion?
There
Seicct your answer - V a significant relatioriship attiuiu tLHe variatles.
Expert Solution
This question has been solved!
Explore an expertly crafted, step-by-step solution for a thorough understanding of key concepts.

Step by step
Solved in 2 steps with 2 images

Recommended textbooks for you
MATLAB: An Introduction with Applications
Statistics
ISBN:
9781119256830
Author:
Amos Gilat
Publisher:
John Wiley & Sons Inc

Probability and Statistics for Engineering and th…
Statistics
ISBN:
9781305251809
Author:
Jay L. Devore
Publisher:
Cengage Learning

Statistics for The Behavioral Sciences (MindTap C…
Statistics
ISBN:
9781305504912
Author:
Frederick J Gravetter, Larry B. Wallnau
Publisher:
Cengage Learning
MATLAB: An Introduction with Applications
Statistics
ISBN:
9781119256830
Author:
Amos Gilat
Publisher:
John Wiley & Sons Inc
Probability and Statistics for Engineering and th…
Statistics
ISBN:
9781305251809
Author:
Jay L. Devore
Publisher:
Cengage Learning
Statistics for The Behavioral Sciences (MindTap C…
Statistics
ISBN:
9781305504912
Author:
Frederick J Gravetter, Larry B. Wallnau
Publisher:
Cengage Learning

Elementary Statistics: Picturing the World (7th E…
Statistics
ISBN:
9780134683416
Author:
Ron Larson, Betsy Farber
Publisher:
PEARSON

The Basic Practice of Statistics
Statistics
ISBN:
9781319042578
Author:
David S. Moore, William I. Notz, Michael A. Fligner
Publisher:
W. H. Freeman

Introduction to the Practice of Statistics
Statistics
ISBN:
9781319013387
Author:
David S. Moore, George P. McCabe, Bruce A. Craig
Publisher:
W. H. Freeman