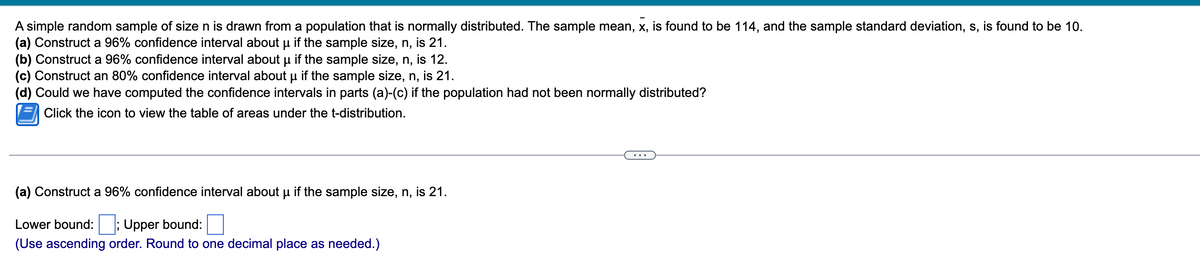
A simple random sample of size n is drawn from a population that is normally distributed. The sample mean, x, is found to be 114, and the sample standard deviation, s, is found to be 10. (a) Construct a 96% confidence interval about µ if the sample size, n, is 21. (b) Construct a 96% confidence interval about µ if the sample size, n, is 12. (c) Construct an 80% confidence interval about u if the sample size, n, is 21.
A simple random sample of size n is drawn from a population that is normally distributed. The sample mean, x, is found to be 114, and the sample standard deviation, s, is found to be 10. (a) Construct a 96% confidence interval about µ if the sample size, n, is 21. (b) Construct a 96% confidence interval about µ if the sample size, n, is 12. (c) Construct an 80% confidence interval about u if the sample size, n, is 21.

MATLAB: An Introduction with Applications
6th Edition
ISBN:9781119256830
Author:Amos Gilat
Publisher:Amos Gilat
Chapter1: Starting With Matlab
Section: Chapter Questions
Problem 1P

Related questions
Question
100%
Transcribed Image Text:A simple random sample of size n is drawn from a population that is normally distributed. The sample mean, x, is found to be 114, and the sample standard deviation, s, is found to be 10.
(a) Construct a 96% confidence interval about µ if the sample size, n, is 21.
(b) Construct a 96% confidence interval about µ if the sample size, n, is 12.
μ
(c) Construct an 80% confidence interval about µ if the sample size, n, is 21.
(d) Could we have computed the confidence intervals in parts (a)-(c) if the population had not been normally distributed?
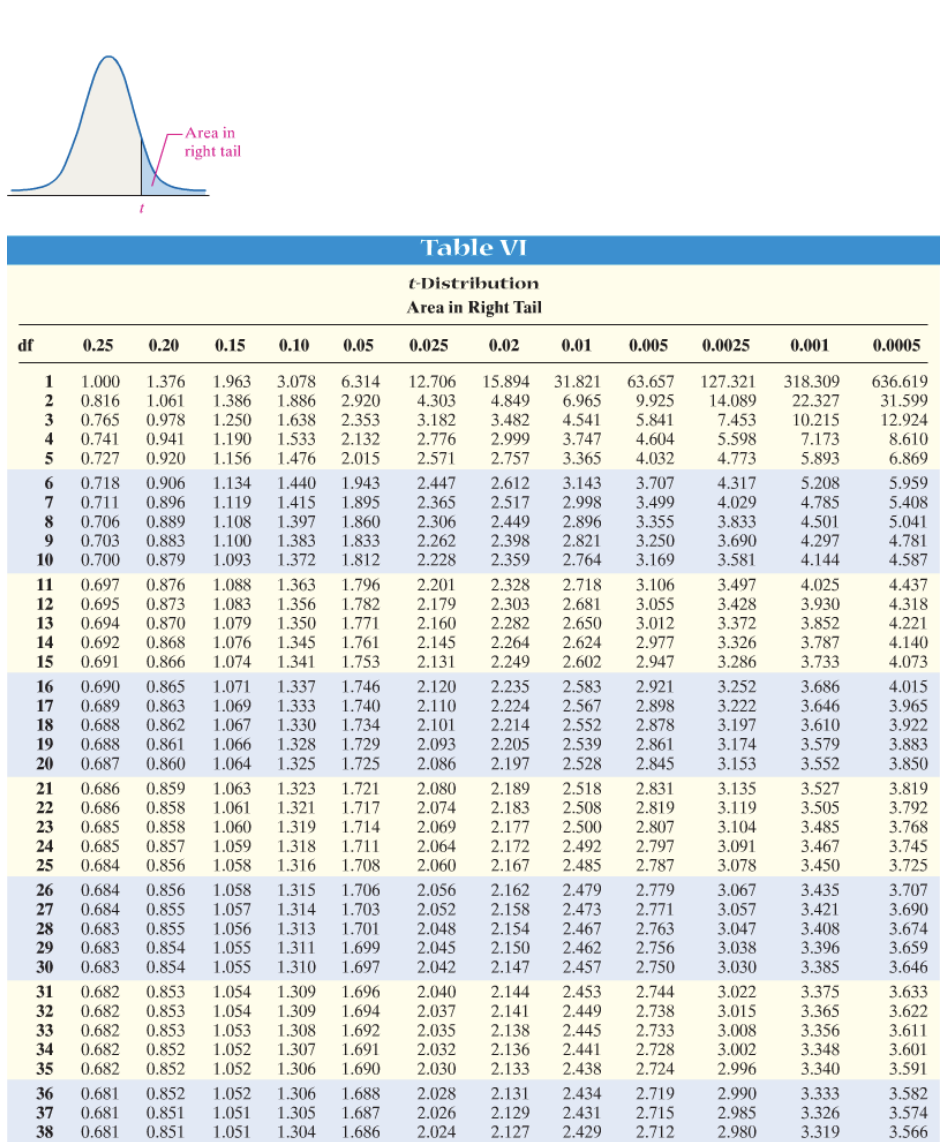
Click the icon to view the table of areas under the t-distribution.
(a) Construct a 96% confidence interval about µ if the sample size, n, is 21.
Lower bound: Upper bound:
(Use ascending order. Round to one decimal place as needed.)
Transcribed Image Text:df
1
2
3
4
5
6
7
8
9
10
0.25
21
22
Area in
right tail
0.20 0.15
1.000 1.376
0.816 1.061
0.765
0.978
0.741 0.941
0.727
0.920
0.05
1.963 3.078 6.314 12.706
1.386 1.886 2.920 4.303
1.638 2.353
1.250
1.190
1.533 2.132
1.156
1.476
2.015
Table VI
t-Distribution
Area in Right Tail
0.10
0.025
0.01
15.894 31.821
4.849 6.965
0.02
3.182 3.482
2.776
2.999
2.571
2.757
0.718
0.906 1.134
1.440
1.943
2.447
2.612 3.143
0.711 0.896 1.119
1.415 1.895
2.365 2.517 2.998
3.355
2.449 2.896
2.398 2.821
3.250
2.359 2.764 3.169
11
2.328 2.718 3.106
12
2.681 3.055
13
2.303
2.282 2.650
2.264 2.624 2.977
3.012
2.602 2.947
2.249
2.235 2.583 2.921
2.224 2.567 2.898
0.706 0.889 1.108 1.397 1.860 2.306
0.703 0.883 1.100 1.383 1.833 2.262
0.700
0.879 1.093 1.372 1.812
2.228
0.697 0.876 1.088 1.363 1.796 2.201
0.695 0.873 1.083 1.356 1.782
2.179
0.694 0.870 1.079 1.350 1.771 2.160
14 0.692 0.868 1.076 1.345 1.761 2.145
15 0.691 0.866 1.074 1.341 1.753 2.131
16 0.690 0.865 1.071 1.337 1.746 2.120
17 0.689 0.863 1.069 1.333 1.740 2.110
18 0.688 0.862 1.067 1.330 1.734 2.101 2.214
2.552 2.878
19 0.688 0.861 1.066 1.328 1.729 2.093 2.205 2.539 2.861
20 0.687 0.860
1.064 1.325 1.725 2.086 2.197
0.686 0.859 1.063
1.323 1.721 2.080
0.686 0.858 1.061 1.321 1.717 2.074
23 0.685 0.858 1.060 1.319 1.714 2.069
24
0.685 0.857 1.059 1.318 1.711 2.064 2.172
25 0.684 0.856 1.058 1.316 1.708 2.060 2.167
26 0.684 0.856
1.706 2.056 2.162
27 0.684 0.855 1.057 1.314 1.703 2.052 2.158
28 0.683 0.855 1.056 1.313 1.701 2.048 2.154
29 0.683 0.854 1.055 1.311 1.699 2.045 2.150 2.462 2.756
30 0.683 0.854
2.042
2.040
2.037
2.528
2.845
2.189
2.518
2.183 2.508
2.177 2.500
1.058 1.315
2.479 2.779
2.473 2.771
2.467 2.763
2.147 2.457 2.750
1.055 1.310 1.697
31 0.682 0.853
1.054
1.309 1.696
32 0.682 0.853 1.054 1.309 1.694
33 0.682 0.853 1.053 1.308 1.692
34 0.682 0.852 1.052 1.307 1.691
35 0.682 0.852 1.052 1.306 1.690
36 0.681 0.852 1.052 1.306 1.688 2.028
37 0.681 0.851 1.051 1.305 1.687 2.026
38 0.681 0.851 1.051 1.304 1.686
2.035
2.032
2.030
0.005
0.001
63.657 127.321 318.309
14.089
22.327
7.453
10.215
5.598
4.773
9.925
4.541 5.841
3.747 4.604
3.365
4.032
3.707
3.499
2.131 2.434
2.129 2.431
2.024 2.127 2.429
2.831
2.819
2.807
2.492 2.797
2.485 2.787
2.144 2.453
2.744
2.141 2.449
2.738
2.138 2.445 2.733
2.136 2.441
2.728
2.133 2.438
2.724
2.719
2.715
2.712
0.0025
4.317
4.029
3.833
3.690
3.581
3.497
3.428
3.372
3.326
3.286
3.252
3.222
3.197
3.174
3.153
3.135
3.119
3.104
3.091
3.078
3.067
3.057
3.047
3.038
3.030
3.022
3.015
3.008
3.002
2.996
2.990
2.985
2.980
7.173
5.893
5.208
4.785
4.501
4.297
4.144
4.025
3.930
3.852
3.787
3.733
3.686
3.646
3.610
3.579
3.552
3.527
3.505
3.485
3.467
3.450
3.435
3.421
3.408
3.396
3.385
3.375
3.365
3.356
3.348
3.340
3.333
3.326
3.319
0.0005
636.619
31.599
12.924
8.610
6.869
5.959
5.408
5.041
4.781
4.587
4.437
4.318
4.221
4.140
4.073
4.015
3.965
3.922
3.883
3.850
3.819
3.792
3.768
3.745
3.725
3.707
3.690
3.674
3.659
3.646
3.633
3.622
3.611
3.601
3.591
3.582
3.574
3.566
Expert Solution
This question has been solved!
Explore an expertly crafted, step-by-step solution for a thorough understanding of key concepts.

Step by step
Solved in 4 steps

Recommended textbooks for you
MATLAB: An Introduction with Applications
Statistics
ISBN:
9781119256830
Author:
Amos Gilat
Publisher:
John Wiley & Sons Inc

Probability and Statistics for Engineering and th…
Statistics
ISBN:
9781305251809
Author:
Jay L. Devore
Publisher:
Cengage Learning

Statistics for The Behavioral Sciences (MindTap C…
Statistics
ISBN:
9781305504912
Author:
Frederick J Gravetter, Larry B. Wallnau
Publisher:
Cengage Learning
MATLAB: An Introduction with Applications
Statistics
ISBN:
9781119256830
Author:
Amos Gilat
Publisher:
John Wiley & Sons Inc
Probability and Statistics for Engineering and th…
Statistics
ISBN:
9781305251809
Author:
Jay L. Devore
Publisher:
Cengage Learning
Statistics for The Behavioral Sciences (MindTap C…
Statistics
ISBN:
9781305504912
Author:
Frederick J Gravetter, Larry B. Wallnau
Publisher:
Cengage Learning

Elementary Statistics: Picturing the World (7th E…
Statistics
ISBN:
9780134683416
Author:
Ron Larson, Betsy Farber
Publisher:
PEARSON

The Basic Practice of Statistics
Statistics
ISBN:
9781319042578
Author:
David S. Moore, William I. Notz, Michael A. Fligner
Publisher:
W. H. Freeman

Introduction to the Practice of Statistics
Statistics
ISBN:
9781319013387
Author:
David S. Moore, George P. McCabe, Bruce A. Craig
Publisher:
W. H. Freeman