a) Since data were collected for 1 ✓ make is a histogram quantitatve b) Using the formula class width = (maxx - minX)/(number of classes) and rounding up to the next whole number, the class width is Complete the frequency/relative frequency table using 5 classes. Round relative frequencies to 3 decimal places. Classes 113.5- variable(s), the correct graph to Frequency Relative Frequency 100
a) Since data were collected for 1 ✓ make is a histogram quantitatve b) Using the formula class width = (maxx - minX)/(number of classes) and rounding up to the next whole number, the class width is Complete the frequency/relative frequency table using 5 classes. Round relative frequencies to 3 decimal places. Classes 113.5- variable(s), the correct graph to Frequency Relative Frequency 100

Glencoe Algebra 1, Student Edition, 9780079039897, 0079039898, 2018
18th Edition
ISBN:9780079039897
Author:Carter
Publisher:Carter
Chapter10: Statistics
Section10.6: Summarizing Categorical Data
Problem 30PPS

Related questions
Question
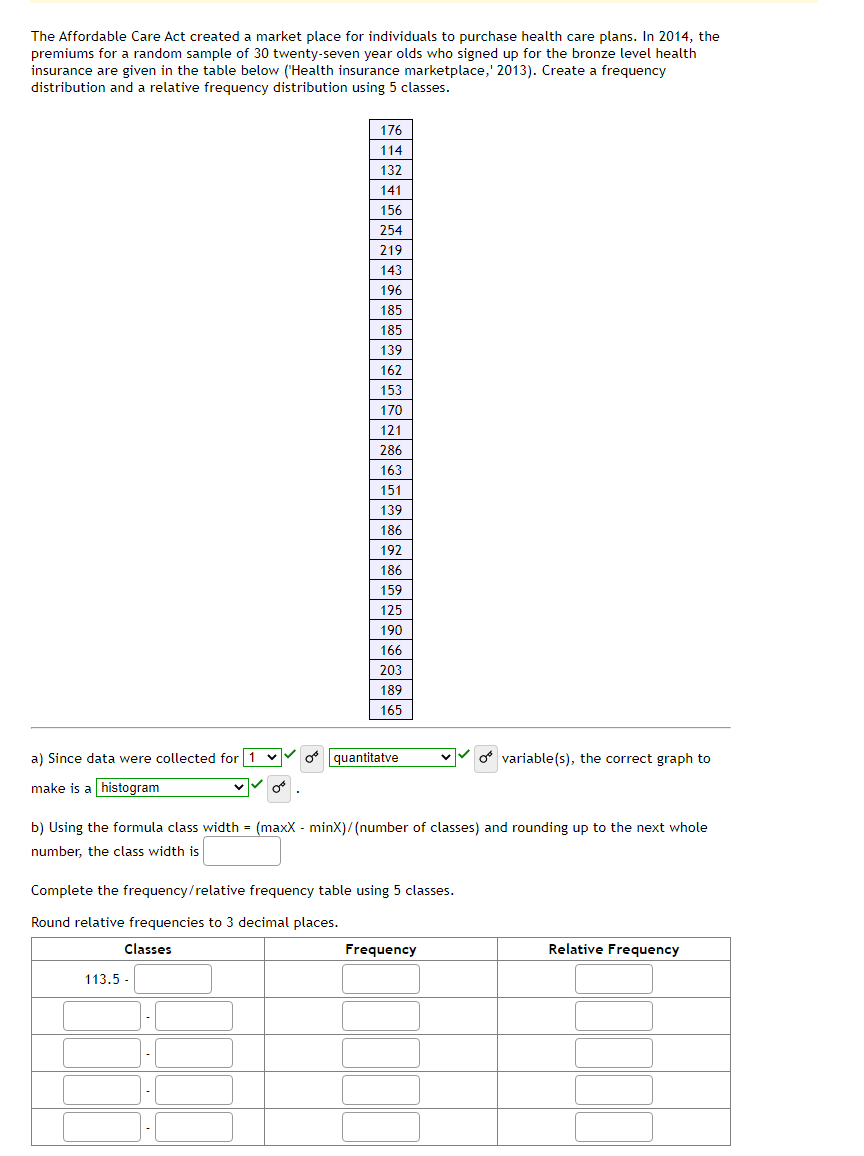
Transcribed Image Text:The Affordable Care Act created a market place for individuals to purchase health care plans. In 2014, the
premiums for a random sample of 30 twenty-seven year olds who signed up for the bronze level health
insurance are given in the table below ('Health insurance marketplace,' 2013). Create a frequency
distribution and a relative frequency distribution using 5 classes.
a) Since data were collected for
make is a histogram
176
114
132
141
156
254
219
113.5-
143
196
185
185
139
162
153
170
121
286
163
151
139
186
192
186
159
125
190
166
203
189
165
quantitatve
b) Using the formula class width = (maxX - minX)/(number of classes) and rounding up to the next whole
number, the class width is
Complete the frequency/relative frequency table using 5 classes.
Round relative frequencies to 3 decimal places.
Classes
variable(s), the correct graph to
Frequency
Relative Frequency
Expert Solution
This question has been solved!
Explore an expertly crafted, step-by-step solution for a thorough understanding of key concepts.

This is a popular solution!

Trending now
This is a popular solution!

Step by step
Solved in 2 steps with 2 images

Recommended textbooks for you
Glencoe Algebra 1, Student Edition, 9780079039897…
Algebra
ISBN:
9780079039897
Author:
Carter
Publisher:
McGraw Hill
Glencoe Algebra 1, Student Edition, 9780079039897…
Algebra
ISBN:
9780079039897
Author:
Carter
Publisher:
McGraw Hill