(a) Smoking is detrimental to health. The following shows the years of smoking and life expectancy at the age of 40 for 5 female employees working at Ernst & Young. Employee i Anne Lena Ying Нyuna Sasha xi 25 22 20 17 yi 63 62 75 72 68 (i) Treating the data as a sample, compute sxy and rxy. (ii) Treating the data as the population, compute oxy and pxy.
(a) Smoking is detrimental to health. The following shows the years of smoking and life expectancy at the age of 40 for 5 female employees working at Ernst & Young. Employee i Anne Lena Ying Нyuna Sasha xi 25 22 20 17 yi 63 62 75 72 68 (i) Treating the data as a sample, compute sxy and rxy. (ii) Treating the data as the population, compute oxy and pxy.

Linear Algebra: A Modern Introduction
4th Edition
ISBN:9781285463247
Author:David Poole
Publisher:David Poole
Chapter7: Distance And Approximation
Section7.3: Least Squares Approximation
Problem 31EQ

Related questions

Question
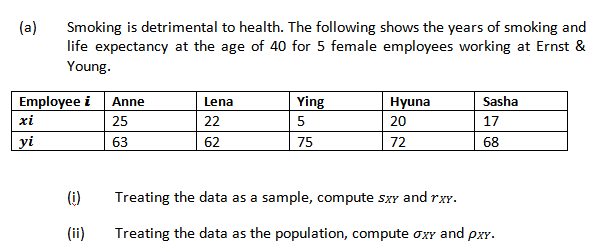
Smoking is detrimental to health. The following shows the years of smoking and life expectancy at the age of 40 for 5 female employees working at Ernst & Young.
|
Employee ? |
Anne |
Lena |
Ying |
Hyuna |
Sasha |
|
?? |
25 |
22 |
5 |
20 |
17 |
|
?? |
63 |
62 |
75 |
72 |
68 |
(i) Treating the data as a sample, compute ??? and ???.
(ii) Treating the data as the population, compute ??? and ???.
Transcribed Image Text:(a)
Smoking is detrimental to health. The following shows the years of smoking and
life expectancy at the age of 40 for 5 female employees working at Ernst &
Young.
Employee i Anne
Ying
Lena
Hyuna
Sasha
xi
25
22
5
20
17
yi
63
62
75
72
68
(i)
Treating the data as a sample, compute sxY and rxy.
(ii)
Treating the data as the population, compute oxy and pxy.
Expert Solution
This question has been solved!
Explore an expertly crafted, step-by-step solution for a thorough understanding of key concepts.

Step by step
Solved in 5 steps with 5 images

Knowledge Booster


Learn more about
Need a deep-dive on the concept behind this application? Look no further. Learn more about this topic, statistics and related others by exploring similar questions and additional content below.Recommended textbooks for you
Linear Algebra: A Modern Introduction
Algebra
ISBN:
9781285463247
Author:
David Poole
Publisher:
Cengage Learning

Glencoe Algebra 1, Student Edition, 9780079039897…
Algebra
ISBN:
9780079039897
Author:
Carter
Publisher:
McGraw Hill

Functions and Change: A Modeling Approach to Coll…
Algebra
ISBN:
9781337111348
Author:
Bruce Crauder, Benny Evans, Alan Noell
Publisher:
Cengage Learning
Linear Algebra: A Modern Introduction
Algebra
ISBN:
9781285463247
Author:
David Poole
Publisher:
Cengage Learning
Glencoe Algebra 1, Student Edition, 9780079039897…
Algebra
ISBN:
9780079039897
Author:
Carter
Publisher:
McGraw Hill
Functions and Change: A Modeling Approach to Coll…
Algebra
ISBN:
9781337111348
Author:
Bruce Crauder, Benny Evans, Alan Noell
Publisher:
Cengage Learning