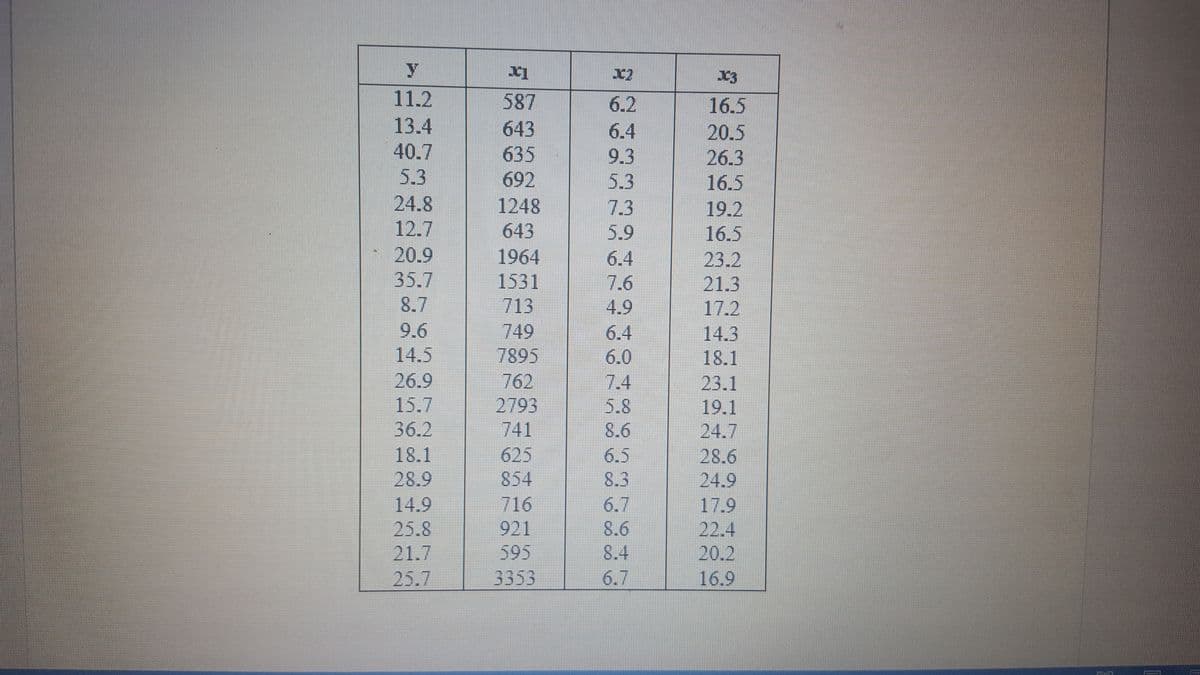
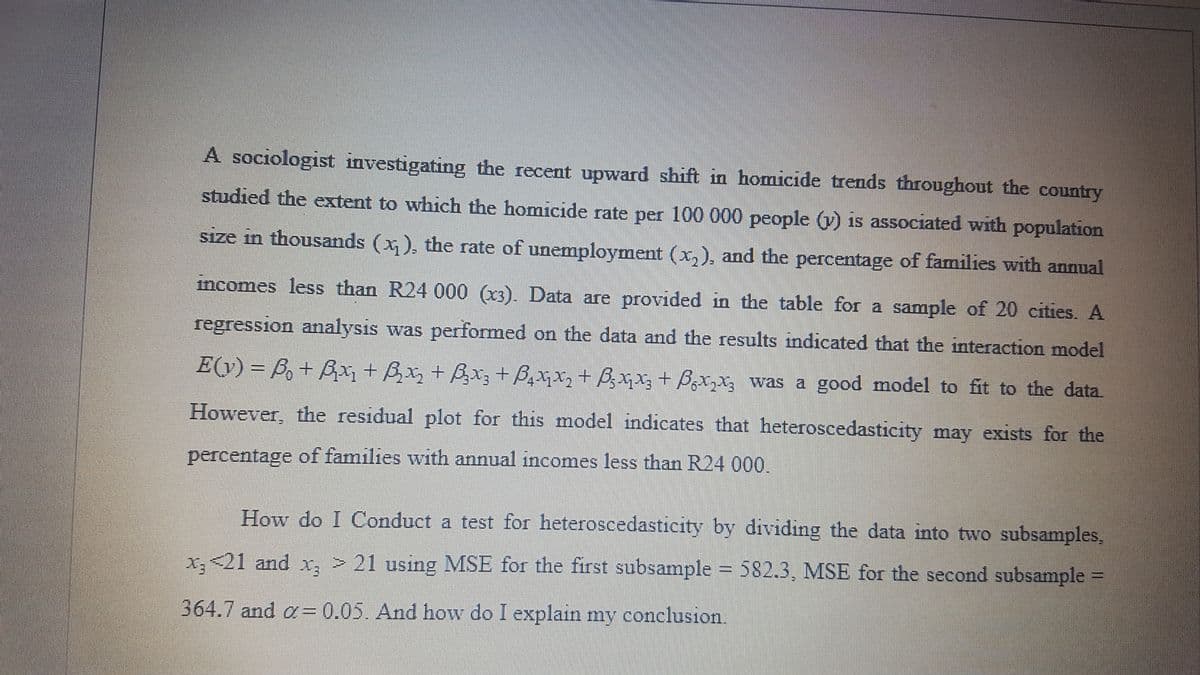
A sociologist investigating the recent upward shift in homicide trends throughout the country studied the extent to which the homicide rate per 100 000 people (y) is associated with population size in thousands (x), the rate of unemployment (x,), and the percentage of families with annual incomes less than R24 000 (x3). Data are provided in the table for a sample of 20 cities. A regression analysis was performed on the data and the results indicated that the interaction model E(v) = B, + B + Bx+ Bx; + B,xx2+ B;xX3 + Bx,x3 was a good model to fit to the data. %3D However, the residual plot for this model indicates that heteroscedasticity may exists for the percentage of families with annual incomes less than R24 000.


Correlation
Correlation defines a relationship between two independent variables. It tells the degree to which variables move in relation to each other. When two sets of data are related to each other, there is a correlation between them.
Linear Correlation
A correlation is used to determine the relationships between numerical and categorical variables. In other words, it is an indicator of how things are connected to one another. The correlation analysis is the study of how variables are related.
Regression Analysis
Regression analysis is a statistical method in which it estimates the relationship between a dependent variable and one or more independent variable. In simple terms dependent variable is called as outcome variable and independent variable is called as predictors. Regression analysis is one of the methods to find the trends in data. The independent variable used in Regression analysis is named Predictor variable. It offers data of an associated dependent variable regarding a particular outcome.

Step by step
Solved in 2 steps with 1 images


