A software company markets a new computer game with two experimental packaging designs. Design 1 is sent to 11 stores; their average sales the first month is 52 units with sample standard deviation 12 units. Design 2 is sent to 6 stores; their average sales the first month is 46 units with a sample standard deviation of 10 units. It is desired to test, at the 0.01 level of significance whether the data provide sufficient evidence to conclude that the mean sales per month of the two designs are different. Let µ1 and uz denote the average monthly sales for Design 1 and Design 2, respectively. The following hypotheses are being considered. Ho : µ1 – µ2 = 0 versus H1 : µ1 – µ2 # 0. The pooled sample variance equals (Give your answer precise to one decimal place, e.g., 12.8, 27.3, 4.0.) The value of the test statistic equals . (Give your answer precise to one decimal place, e.g., 12.8, 27.3, 4.0.) The reference distribution is the t-distribution with degrees of freedom. The rejection region is bounded by the following critical values:± . (Give your answer precise to three decimal places.) The decision from the test is to the null hypothesis. (Write "reject" or "not reject").
A software company markets a new computer game with two experimental packaging designs. Design 1 is sent to 11 stores; their average sales the first month is 52 units with sample standard deviation 12 units. Design 2 is sent to 6 stores; their average sales the first month is 46 units with a sample standard deviation of 10 units. It is desired to test, at the 0.01 level of significance whether the data provide sufficient evidence to conclude that the mean sales per month of the two designs are different. Let µ1 and uz denote the average monthly sales for Design 1 and Design 2, respectively. The following hypotheses are being considered. Ho : µ1 – µ2 = 0 versus H1 : µ1 – µ2 # 0. The pooled sample variance equals (Give your answer precise to one decimal place, e.g., 12.8, 27.3, 4.0.) The value of the test statistic equals . (Give your answer precise to one decimal place, e.g., 12.8, 27.3, 4.0.) The reference distribution is the t-distribution with degrees of freedom. The rejection region is bounded by the following critical values:± . (Give your answer precise to three decimal places.) The decision from the test is to the null hypothesis. (Write "reject" or "not reject").

MATLAB: An Introduction with Applications
6th Edition
ISBN:9781119256830
Author:Amos Gilat
Publisher:Amos Gilat
Chapter1: Starting With Matlab
Section: Chapter Questions
Problem 1P

Related questions
Question
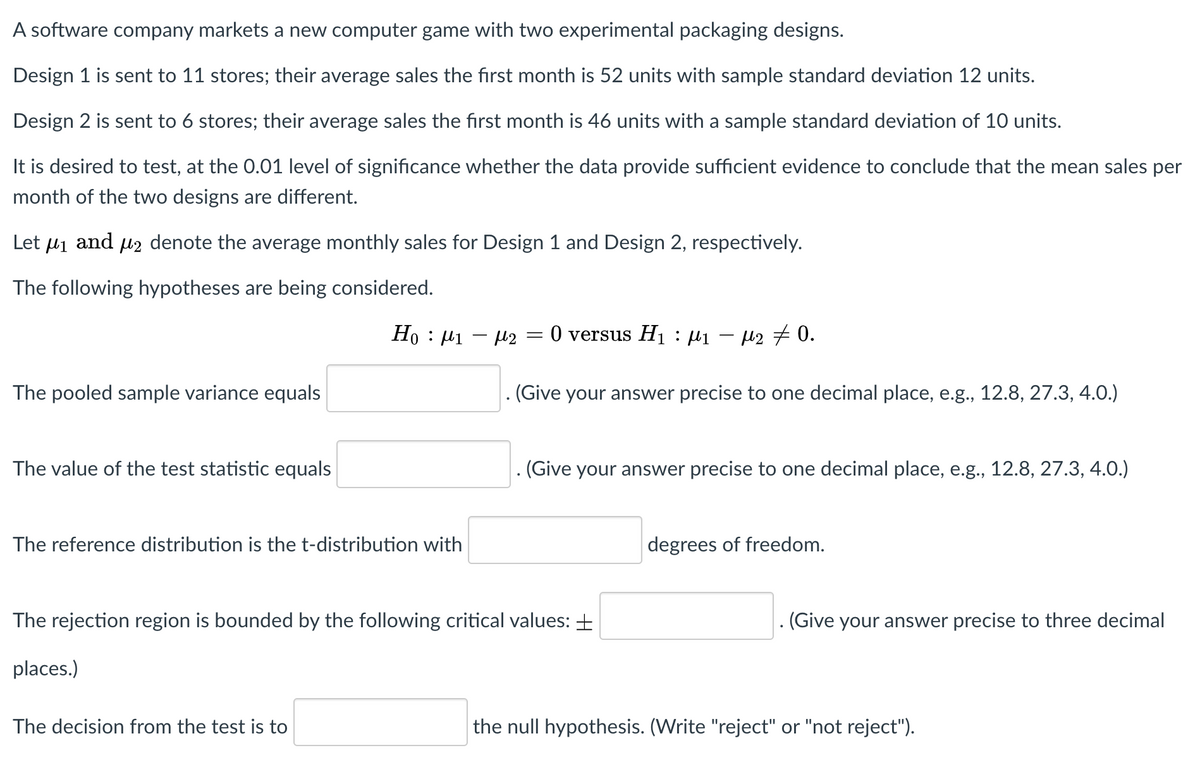
Transcribed Image Text:A software company markets a new computer game with two experimental packaging designs.
Design 1 is sent to 11 stores; their average sales the first month is 52 units with sample standard deviation 12 units.
Design 2 is sent to 6 stores; their average sales the first month is 46 units with a sample standard deviation of 10 units.
It is desired to test, at the 0.01 level of significance whether the data provide sufficient evidence to conclude that the mean sales per
month of the two designs are different.
Let Hi
and
l2 denote the average monthly sales for Design 1 and Design 2, respectively.
The following hypotheses are being considered.
Ho : 41
-12 =0 versus H1 : µ1 – µ2 7 0.
%3D
The pooled sample variance equals
(Give your answer precise to one decimal place, e.g., 12.8, 27.3, 4.0.)
The value of the test statistic equals
(Give your answer precise to one decimal place, e.g., 12.8, 27.3, 4.0.)
The reference distribution is the t-distribution with
degrees of freedom.
The rejection region is bounded by the following critical values: +
. (Give your answer precise to three decimal
places.)
The decision from the test is to
the null hypothesis. (Write "reject" or "not reject").
Expert Solution
This question has been solved!
Explore an expertly crafted, step-by-step solution for a thorough understanding of key concepts.

Step by step
Solved in 3 steps with 3 images

Recommended textbooks for you
MATLAB: An Introduction with Applications
Statistics
ISBN:
9781119256830
Author:
Amos Gilat
Publisher:
John Wiley & Sons Inc

Probability and Statistics for Engineering and th…
Statistics
ISBN:
9781305251809
Author:
Jay L. Devore
Publisher:
Cengage Learning

Statistics for The Behavioral Sciences (MindTap C…
Statistics
ISBN:
9781305504912
Author:
Frederick J Gravetter, Larry B. Wallnau
Publisher:
Cengage Learning
MATLAB: An Introduction with Applications
Statistics
ISBN:
9781119256830
Author:
Amos Gilat
Publisher:
John Wiley & Sons Inc
Probability and Statistics for Engineering and th…
Statistics
ISBN:
9781305251809
Author:
Jay L. Devore
Publisher:
Cengage Learning
Statistics for The Behavioral Sciences (MindTap C…
Statistics
ISBN:
9781305504912
Author:
Frederick J Gravetter, Larry B. Wallnau
Publisher:
Cengage Learning

Elementary Statistics: Picturing the World (7th E…
Statistics
ISBN:
9780134683416
Author:
Ron Larson, Betsy Farber
Publisher:
PEARSON

The Basic Practice of Statistics
Statistics
ISBN:
9781319042578
Author:
David S. Moore, William I. Notz, Michael A. Fligner
Publisher:
W. H. Freeman

Introduction to the Practice of Statistics
Statistics
ISBN:
9781319013387
Author:
David S. Moore, George P. McCabe, Bruce A. Craig
Publisher:
W. H. Freeman