A software company markets a new computer game with two experimental packaging designs. Design 1 is sent to 11 stores and their average sale the first month is 52 units with sample standard deviation 12 units. Design 2 is sent to 6 stores and their average sale the first month is 46 units with sample standard deviation 10 units. a. Compute and interpret a point estimate for the difference in average monthly sales between the two package designs. b. Construct and interpret a 95% confidence interval for the difference in average monthly sales between the two package designs. To
A software company markets a new computer game with two experimental packaging designs. Design 1 is sent to 11 stores and their average sale the first month is 52 units with sample standard deviation 12 units. Design 2 is sent to 6 stores and their average sale the first month is 46 units with sample standard deviation 10 units. a. Compute and interpret a point estimate for the difference in average monthly sales between the two package designs. b. Construct and interpret a 95% confidence interval for the difference in average monthly sales between the two package designs. To

Glencoe Algebra 1, Student Edition, 9780079039897, 0079039898, 2018
18th Edition
ISBN:9780079039897
Author:Carter
Publisher:Carter
Chapter4: Equations Of Linear Functions
Section: Chapter Questions
Problem 8SGR

Related questions
Question
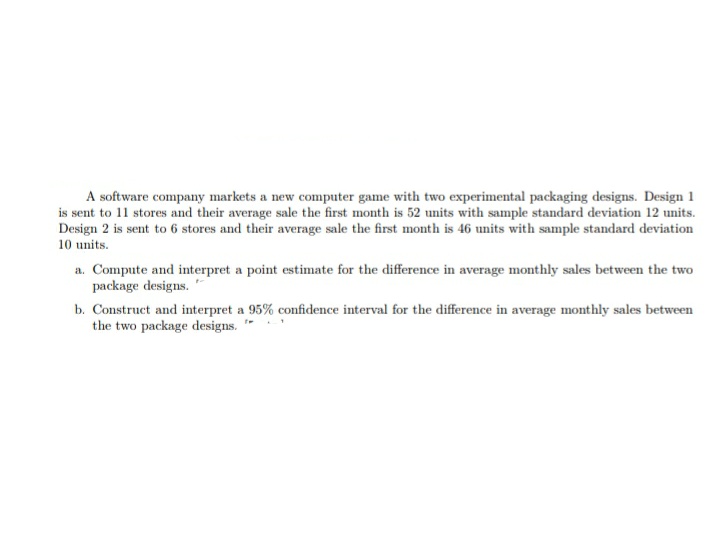
Transcribed Image Text:A software company markets a new computer game with two experimental packaging designs. Design 1
is sent to 11 stores and their average sale the first month is 52 units with sample standard deviation 12 units.
Design 2 is sent to 6 stores and their average sale the first month is 46 units with sample standard deviation
10 units.
a. Compute and interpret a point estimate for the difference in average monthly sales between the two
package designs.
b. Construct and interpret a 95% confidence interval for the difference in average monthly sales between
the two package designs.
Expert Solution
This question has been solved!
Explore an expertly crafted, step-by-step solution for a thorough understanding of key concepts.

Step by step
Solved in 2 steps

Recommended textbooks for you
Glencoe Algebra 1, Student Edition, 9780079039897…
Algebra
ISBN:
9780079039897
Author:
Carter
Publisher:
McGraw Hill

College Algebra (MindTap Course List)
Algebra
ISBN:
9781305652231
Author:
R. David Gustafson, Jeff Hughes
Publisher:
Cengage Learning
Glencoe Algebra 1, Student Edition, 9780079039897…
Algebra
ISBN:
9780079039897
Author:
Carter
Publisher:
McGraw Hill
College Algebra (MindTap Course List)
Algebra
ISBN:
9781305652231
Author:
R. David Gustafson, Jeff Hughes
Publisher:
Cengage Learning