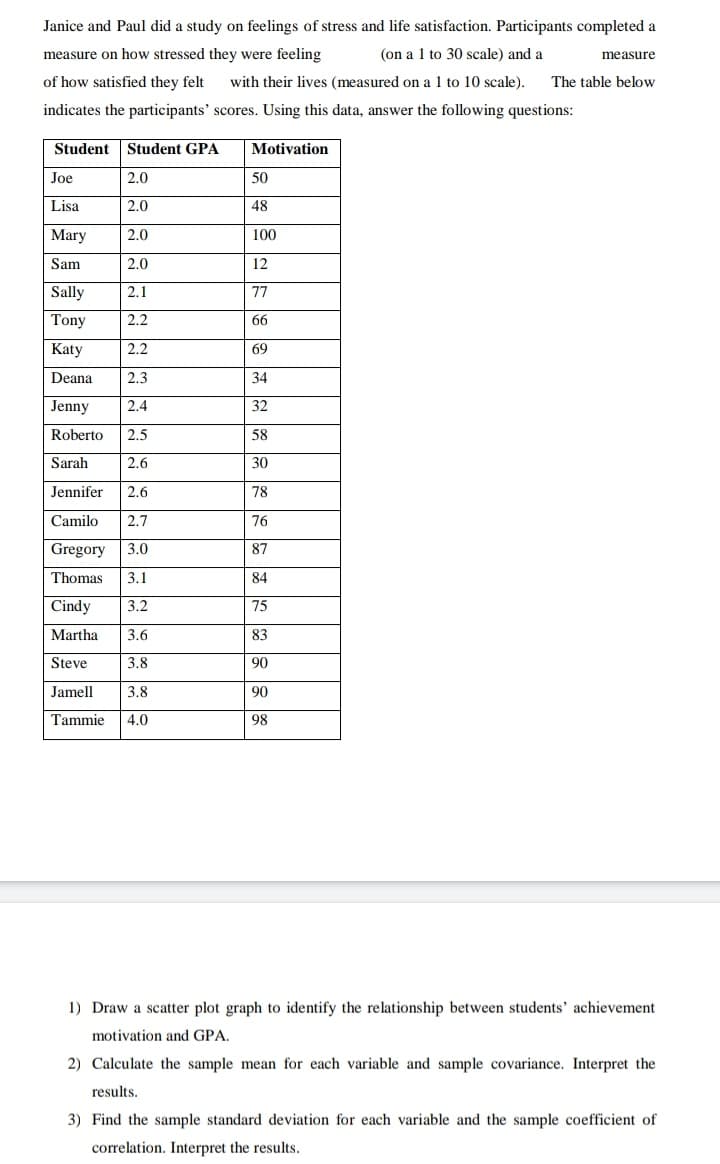
Janice and Paul did a study on feelings of stress and life satisfaction. Participants completed a measure on how stressed they were feeling (on a 1 to 30 scale) and a measure of how satisfied they felt with their lives (measured on a 1 to 10 scale). The table below indicates the participants' scores. Using this data, answer the following questions: Student Student GPA Motivation Joe 2.0 50 Lisa | 2.0 48 Mary 2.0 100 Sam 2.0 12 Sally 2.1 77 Tony 2.2 66 Katy 2.2 69 Deana 2.3 34 Jenny 2.4 32 Roberto 2.5 58 Sarah 2.6 30 Jennifer 2.6 78 Camilo 2.7 76 Gregory 3.0 87 Thomas 3.1 84 Cindy 3.2 75 Martha 3.6 83 Steve 3.8 90 Jamell 3.8 90 Tammie 4.0 98 1) Draw a scatter plot graph to identify the relationship between students' achievement motivation and GPA. 2) Calculate the sample mean for each variable and sample covariance. Interpret the results. 3) Find the sample standard deviation for each variable and the sample coefficient of correlation. Interpret the results.
Janice and Paul did a study on feelings of stress and life satisfaction. Participants completed a measure on how stressed they were feeling (on a 1 to 30 scale) and a measure of how satisfied they felt with their lives (measured on a 1 to 10 scale). The table below indicates the participants' scores. Using this data, answer the following questions: Student Student GPA Motivation Joe 2.0 50 Lisa | 2.0 48 Mary 2.0 100 Sam 2.0 12 Sally 2.1 77 Tony 2.2 66 Katy 2.2 69 Deana 2.3 34 Jenny 2.4 32 Roberto 2.5 58 Sarah 2.6 30 Jennifer 2.6 78 Camilo 2.7 76 Gregory 3.0 87 Thomas 3.1 84 Cindy 3.2 75 Martha 3.6 83 Steve 3.8 90 Jamell 3.8 90 Tammie 4.0 98 1) Draw a scatter plot graph to identify the relationship between students' achievement motivation and GPA. 2) Calculate the sample mean for each variable and sample covariance. Interpret the results. 3) Find the sample standard deviation for each variable and the sample coefficient of correlation. Interpret the results.

Glencoe Algebra 1, Student Edition, 9780079039897, 0079039898, 2018
18th Edition
ISBN:9780079039897
Author:Carter
Publisher:Carter
Chapter10: Statistics
Section10.6: Summarizing Categorical Data
Problem 42PFA

Related questions
Question
Transcribed Image Text:Janice and Paul did a study on feelings of stress and life satisfaction. Participants completed a
measure on how stressed they were feeling
(on a 1 to 30 scale) and a
measure
of how satisfied they felt
with their lives (measured on a 1 to 10 scale).
The table below
indicates the participants' scores. Using this data, answer the following questions:
Student
Student GPA
Motivation
Joe
2.0
50
Lisa
2.0
48
Mary
2.0
100
Sam
2.0
12
Sally
2.1
77
Tony
2.2
66
Katy
2.2
69
Deana
2.3
34
Jenny
2.4
32
Roberto
2.5
58
Sarah
2.6
30
Jennifer
2.6
78
Camilo
2.7
76
Gregory
3.0
87
Thomas
3.1
84
Cindy
3.2
75
Martha
3.6
83
Steve
3.8
90
Jamell
3.8
90
Tammie
4.0
98
1) Draw a scatter plot graph to identify the relationship between students' achievement
motivation and GPA.
2) Calculate the sample mean for each variable and sample covariance. Interpret the
results.
3) Find the sample standard deviation for each variable and the sample coefficient of
correlation. Interpret the results.
Expert Solution
This question has been solved!
Explore an expertly crafted, step-by-step solution for a thorough understanding of key concepts.

This is a popular solution!

Trending now
This is a popular solution!

Step by step
Solved in 5 steps with 2 images

Knowledge Booster


Learn more about
Need a deep-dive on the concept behind this application? Look no further. Learn more about this topic, statistics and related others by exploring similar questions and additional content below.Recommended textbooks for you
Glencoe Algebra 1, Student Edition, 9780079039897…
Algebra
ISBN:
9780079039897
Author:
Carter
Publisher:
McGraw Hill
Glencoe Algebra 1, Student Edition, 9780079039897…
Algebra
ISBN:
9780079039897
Author:
Carter
Publisher:
McGraw Hill