Does the data provide evidence of an association between age and opinion of the band? Justify your answer.
Does the data provide evidence of an association between age and opinion of the band? Justify your answer.

Functions and Change: A Modeling Approach to College Algebra (MindTap Course List)
6th Edition
ISBN:9781337111348
Author:Bruce Crauder, Benny Evans, Alan Noell
Publisher:Bruce Crauder, Benny Evans, Alan Noell
Chapter5: A Survey Of Other Common Functions
Section5.3: Modeling Data With Power Functions
Problem 6E: Urban Travel Times Population of cities and driving times are related, as shown in the accompanying...

Related questions
Question
C) Does the data provide evidence of an association between age and opinion of the band? Justify your answer.
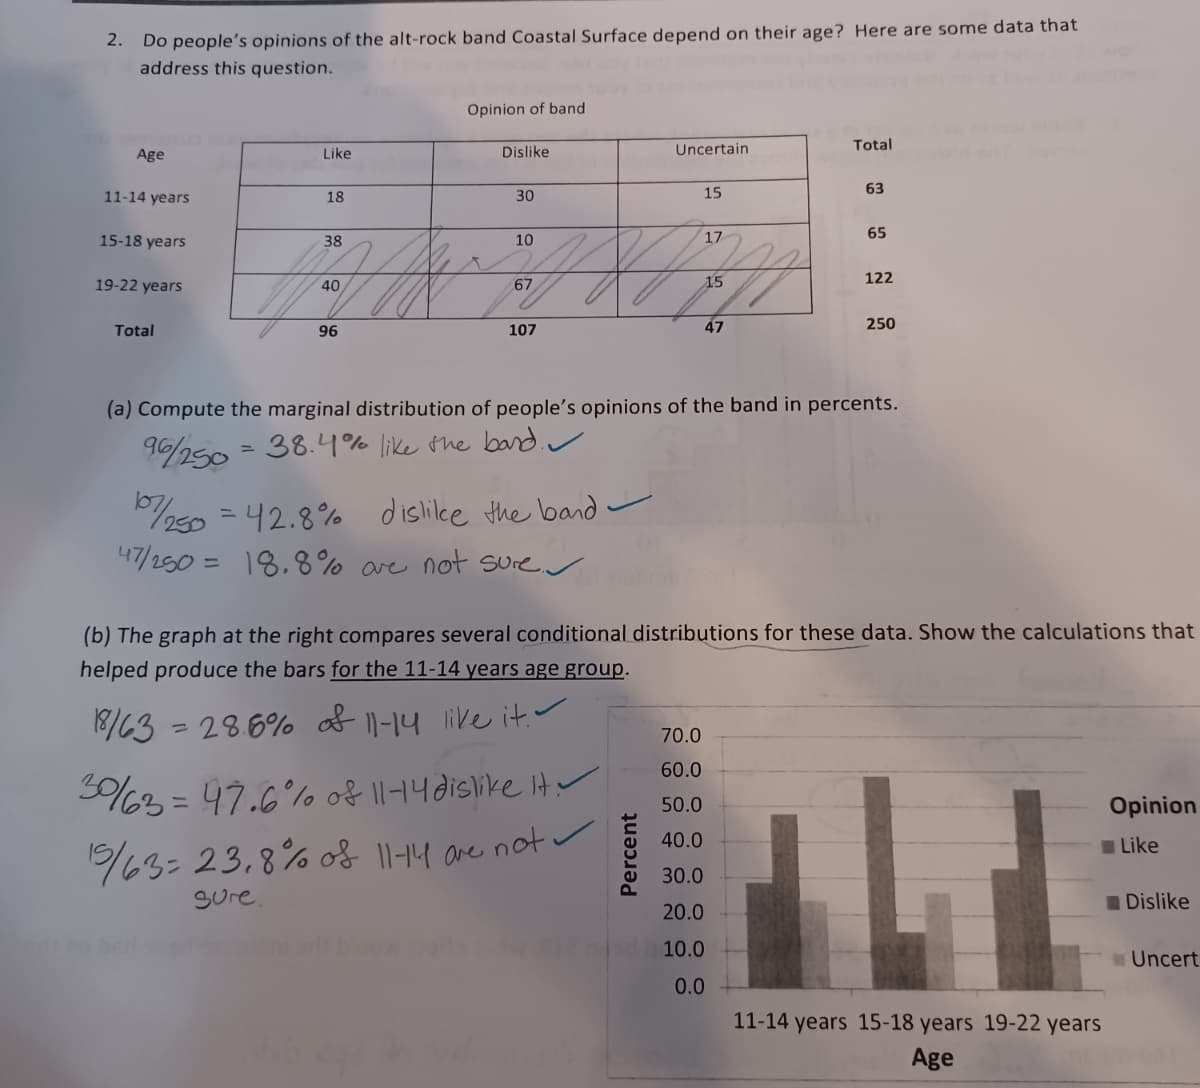
Transcribed Image Text:2.
Do people's opinions of the alt-rock band Coastal Surface depend on their age? Here are some data that
address this question.
Age
11-14 years
15-18 years
19-22 years
Total
Like
=
18
38
40
96
Opinion of band
Dislike
30
10
67
107
107250 = 42.8%
dislikce the band.
47/250 = 18.8% are not sure. ✓
Uncertain
15
Percent
17
15
47
Total
63
(a) Compute the marginal distribution of people's opinions of the band in percents.
96/250
38.4% like the band.
70.0
60.0
50.0
40.0
30.0
20.0
10.0
0.0
65
122
250
(b) The graph at the right compares several conditional distributions for these data. Show the calculations that
helped produce the bars for the 11-14 years age group.
18/63 = 28.6% of 11-14 like it. ~
3063 = 47.6% of 11-14 dislike it.
15/63= 23,8% of 11-14 are not ✓
sure.
11-14 years 15-18 years 19-22 years
Age
Opinion
Like
Dislike
Uncert
Expert Solution
This question has been solved!
Explore an expertly crafted, step-by-step solution for a thorough understanding of key concepts.

This is a popular solution!

Trending now
This is a popular solution!

Step by step
Solved in 2 steps with 3 images

Recommended textbooks for you
Functions and Change: A Modeling Approach to Coll…
Algebra
ISBN:
9781337111348
Author:
Bruce Crauder, Benny Evans, Alan Noell
Publisher:
Cengage Learning

Linear Algebra: A Modern Introduction
Algebra
ISBN:
9781285463247
Author:
David Poole
Publisher:
Cengage Learning

College Algebra
Algebra
ISBN:
9781305115545
Author:
James Stewart, Lothar Redlin, Saleem Watson
Publisher:
Cengage Learning
Functions and Change: A Modeling Approach to Coll…
Algebra
ISBN:
9781337111348
Author:
Bruce Crauder, Benny Evans, Alan Noell
Publisher:
Cengage Learning
Linear Algebra: A Modern Introduction
Algebra
ISBN:
9781285463247
Author:
David Poole
Publisher:
Cengage Learning
College Algebra
Algebra
ISBN:
9781305115545
Author:
James Stewart, Lothar Redlin, Saleem Watson
Publisher:
Cengage Learning

Glencoe Algebra 1, Student Edition, 9780079039897…
Algebra
ISBN:
9780079039897
Author:
Carter
Publisher:
McGraw Hill