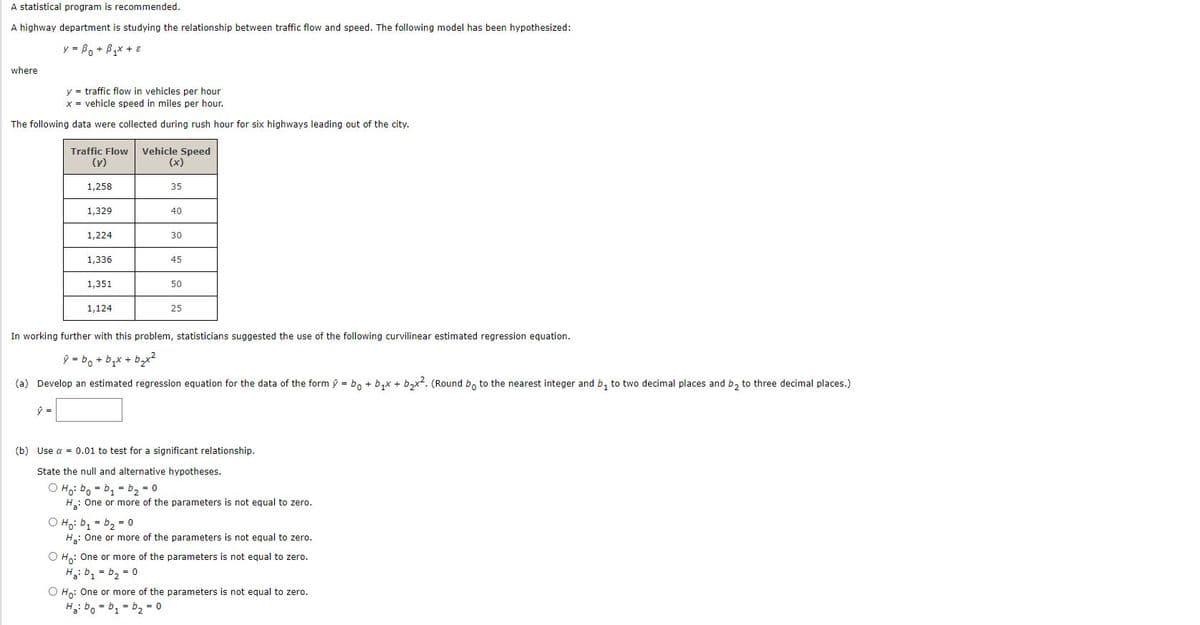
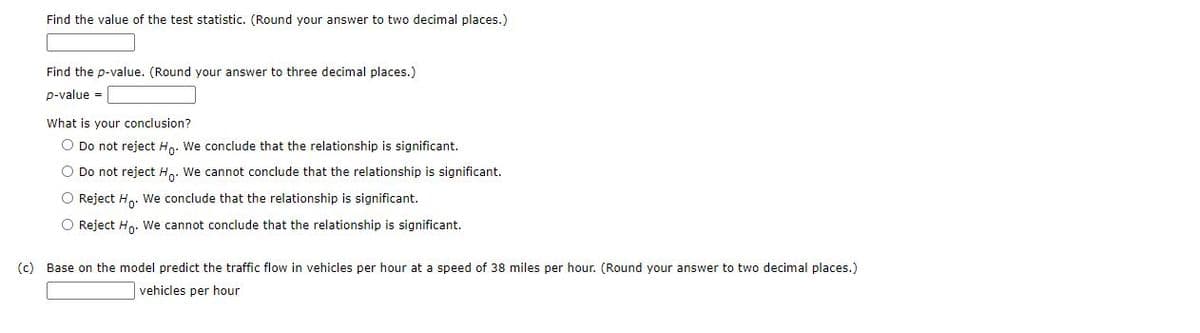
A statistical program is recommended. A highway department is studying the relationship between traffic flow and speed. The following model has been hypothesized: y- Bo + Pax + where y - traffic flow in vehicles per hour x - vehicle speed in miles per hour. The following data were collected during rush hour for six highways leading out of the city. Traffic Flow Vehicle Speed (x) (v) 1,258 35 1,329 40 1,224 30 1,336 45 1,351 50 1,124 25 In working further with this problem, statisticians suggested the use of the following curvilinear estimated regression equation. (a) Develop an estimated regression equation for the data of the form- bo + b,x + b,x2. (Round b, to the nearest integer and b, to two decimal places and b, to three decimal places.) (b) Use a - 0.01 to test for a significant relationship. State the null and alternative hypotheses. O Hoi bo - b, - b, -0 H: One or more of the parameters is not equal to zero. O Ho: b, - b2 - 0 H: One or more of the parameters is not equal to zero. O Ho: One or more of the parameters is not equal to zero. O Ho: One or more of the parameters is not equal to zero. Hi bo- b - b2 -0


Correlation
Correlation defines a relationship between two independent variables. It tells the degree to which variables move in relation to each other. When two sets of data are related to each other, there is a correlation between them.
Linear Correlation
A correlation is used to determine the relationships between numerical and categorical variables. In other words, it is an indicator of how things are connected to one another. The correlation analysis is the study of how variables are related.
Regression Analysis
Regression analysis is a statistical method in which it estimates the relationship between a dependent variable and one or more independent variable. In simple terms dependent variable is called as outcome variable and independent variable is called as predictors. Regression analysis is one of the methods to find the trends in data. The independent variable used in Regression analysis is named Predictor variable. It offers data of an associated dependent variable regarding a particular outcome.

Step by step
Solved in 2 steps with 2 images


