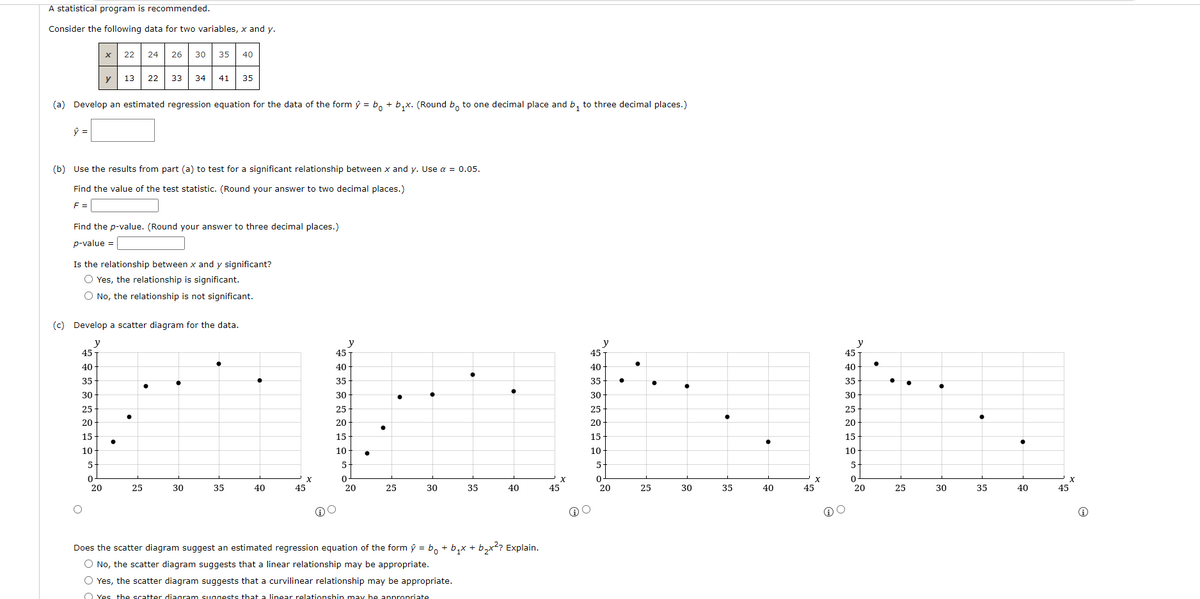
A statistical program is recommended. Consider the following data for two variables, x and y. x 22 24 26 30 35 40 Y 13 22 33 34 41 35 (a) Develop an estimated regression equation for the data of the form ý = b, + b,x. (Round b, to one decimal place and b, to three decimal places.)
A statistical program is recommended. Consider the following data for two variables, x and y. x 22 24 26 30 35 40 Y 13 22 33 34 41 35 (a) Develop an estimated regression equation for the data of the form ý = b, + b,x. (Round b, to one decimal place and b, to three decimal places.)

MATLAB: An Introduction with Applications
6th Edition
ISBN:9781119256830
Author:Amos Gilat
Publisher:Amos Gilat
Chapter1: Starting With Matlab
Section: Chapter Questions
Problem 1P

Related questions
Question
Transcribed Image Text:A statistical program is recommended.
Consider the following data for two variables, x and y.
24 26 30
22
35
40
y
13
22
33
34
41
35
(a) Develop an estimated regression equation for the data of the form ŷ = b, + b,x. (Round b, to one decimal place and b, to three decimal places.)
(b) Use the results from part (a) to test for a significant relationship between x and y. Use a = 0.05.
Find the value of the test statistic. (Round your answer to two decimal places.)
F =
Find the p-value. (Round your answer to three decimal places.)
p-value =
Is the relationship between x and y significant?
O Yes, the relationship is significant.
O No, the relationship is not significant.
(c) Develop a scatter diagram for the data.
y
45
y
45
y
45
y
45 T
40
40-
40
40
35
35-
35
35
30
30
30
30
25
25
25
25
20
20
20
20
15
15
15
15
10
10
10
10
5.
5.
5.
5
20
25
30
35
40
45
20
25
30
35
40
45
20
25
30
35
40
45
20
25
30
35
40
45
Does the scatter diagram suggest an estimated regression equation of the form ý = b, + b,x + b,x? Explain.
O No, the scatter diagram suggests that a linear relationship may be appropriate.
O Yes, the scatter diagram suggests that a curvilinear relationship may be appropriate.
O Yes the scatter diagram suggests that a linear relationshin may be appropriate
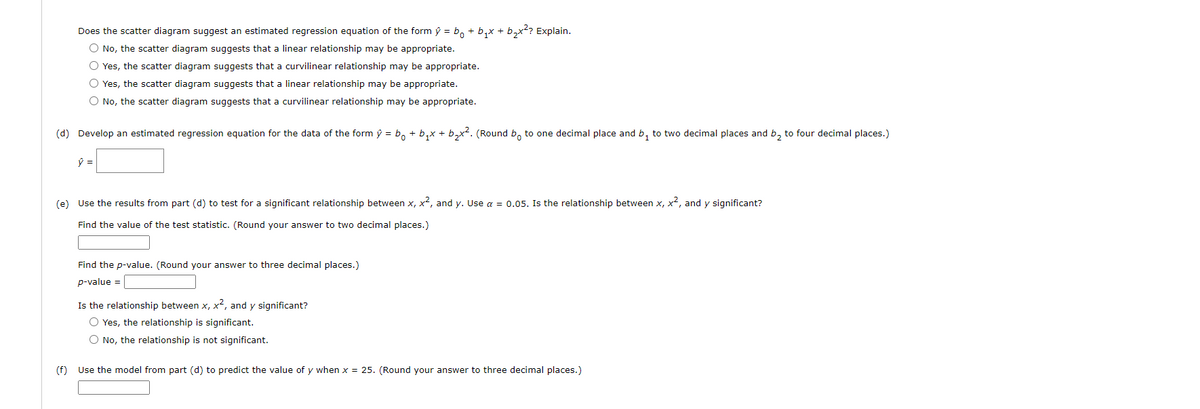
Transcribed Image Text:Does the scatter diagram suggest an estimated regression equation of the form ý = b, + b,x + b,x?? Explain.
O No, the scatter diagram suggests that a linear relationship may be appropriate.
O Yes, the scatter diagram suggests that a curvilinear relationship may be appropriate.
O Yes, the scatter diagram suggests that a linear relationship may be appropriate.
O No, the scatter diagram suggests that a curvilinear relationship may be appropriate.
(d) Develop an estimated regression equation for the data of the form ŷ = b, + b,x + b,x². (Round b, to one decimal place and b, to two decimal places and b, to four decimal places.)
(e) Use the results from part (d) to test for a significant relationship between x, x², and y. Use a = 0.05. Is the relationship between x, x², and y significant?
Find the value of the test statistic. (Round your answer to two decimal places.)
Find the p-value. (Round your answer to three decimal places.)
p-value =
Is the relationship between x, x², and y significant?
O Yes, the relationship is significant.
O No, the relationship is not significant.
(f) Use the model from part (d) to predict the value of y when x = 25. (Round your answer to three decimal places.)
Expert Solution
This question has been solved!
Explore an expertly crafted, step-by-step solution for a thorough understanding of key concepts.

This is a popular solution!

Trending now
This is a popular solution!

Step by step
Solved in 2 steps with 4 images

Recommended textbooks for you
MATLAB: An Introduction with Applications
Statistics
ISBN:
9781119256830
Author:
Amos Gilat
Publisher:
John Wiley & Sons Inc

Probability and Statistics for Engineering and th…
Statistics
ISBN:
9781305251809
Author:
Jay L. Devore
Publisher:
Cengage Learning

Statistics for The Behavioral Sciences (MindTap C…
Statistics
ISBN:
9781305504912
Author:
Frederick J Gravetter, Larry B. Wallnau
Publisher:
Cengage Learning
MATLAB: An Introduction with Applications
Statistics
ISBN:
9781119256830
Author:
Amos Gilat
Publisher:
John Wiley & Sons Inc
Probability and Statistics for Engineering and th…
Statistics
ISBN:
9781305251809
Author:
Jay L. Devore
Publisher:
Cengage Learning
Statistics for The Behavioral Sciences (MindTap C…
Statistics
ISBN:
9781305504912
Author:
Frederick J Gravetter, Larry B. Wallnau
Publisher:
Cengage Learning

Elementary Statistics: Picturing the World (7th E…
Statistics
ISBN:
9780134683416
Author:
Ron Larson, Betsy Farber
Publisher:
PEARSON

The Basic Practice of Statistics
Statistics
ISBN:
9781319042578
Author:
David S. Moore, William I. Notz, Michael A. Fligner
Publisher:
W. H. Freeman

Introduction to the Practice of Statistics
Statistics
ISBN:
9781319013387
Author:
David S. Moore, George P. McCabe, Bruce A. Craig
Publisher:
W. H. Freeman