A student at a large university suspects Mr. Harsh is grading his statistics students too harshly. The student determines that over the past 2 years students in all sections of statistics (taught by other teachers) received grades of A, B, C, D, or F in the following proportions: A: 0.20; B: 0.30; C: 0.30; D: 0.10; and F: 0.10. The student then takes an SRS of 90 students who took statistics with Mr. Harsh in the past 2 years and gathers the following information: Grade Number of students B 26 12 28 15 The student performs the appropriate y2 procedure to test the hypothesis that the teacher's grade distribution is different from the other teachers Which of the following expressions represents the expected count of the grade category D? O (0.10)(90) O 1s? 90 (15-9) O (0.10)(15)
A student at a large university suspects Mr. Harsh is grading his statistics students too harshly. The student determines that over the past 2 years students in all sections of statistics (taught by other teachers) received grades of A, B, C, D, or F in the following proportions: A: 0.20; B: 0.30; C: 0.30; D: 0.10; and F: 0.10. The student then takes an SRS of 90 students who took statistics with Mr. Harsh in the past 2 years and gathers the following information: Grade Number of students B 26 12 28 15 The student performs the appropriate y2 procedure to test the hypothesis that the teacher's grade distribution is different from the other teachers Which of the following expressions represents the expected count of the grade category D? O (0.10)(90) O 1s? 90 (15-9) O (0.10)(15)

Glencoe Algebra 1, Student Edition, 9780079039897, 0079039898, 2018
18th Edition
ISBN:9780079039897
Author:Carter
Publisher:Carter
Chapter10: Statistics
Section10.4: Distributions Of Data
Problem 19PFA

Related questions

Concept explainers
Contingency Table
A contingency table can be defined as the visual representation of the relationship between two or more categorical variables that can be evaluated and registered. It is a categorical version of the scatterplot, which is used to investigate the linear relationship between two variables. A contingency table is indeed a type of frequency distribution table that displays two variables at the same time.
Binomial Distribution
Binomial is an algebraic expression of the sum or the difference of two terms. Before knowing about binomial distribution, we must know about the binomial theorem.
Topic Video
Question
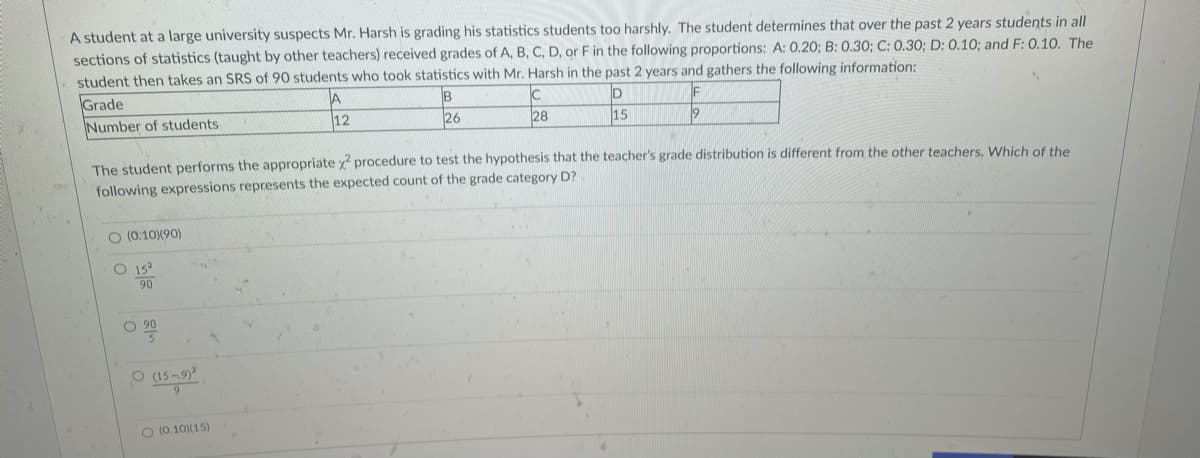
Transcribed Image Text:A student at a large university suspects Mr. Harsh is grading his statistics students too harshly. The student determines that over the past 2 years students in all
sections of statistics (taught by other teachers) received grades of A, B, C, D, or F in the following proportions: A: 0.20; B: 0.30; C: 0.30; D: 0.10; and F: 0.10. The
student then takes an SRS of 90 students who took statistics with Mr. Harsh in the past 2 years and gathers the following information:
Grade
Number of students
B
26
12
28
15
The student performs the appropriate x procedure to test the hypothesis that the teacher's grade distribution is different from the other teachers, Which of the
following expressions represents the expected count of the grade category D?
O (0.10)(90)
O 15?
90
(15-9)
O (0.10)(15)
Expert Solution
This question has been solved!
Explore an expertly crafted, step-by-step solution for a thorough understanding of key concepts.

This is a popular solution!

Trending now
This is a popular solution!

Step by step
Solved in 2 steps

Knowledge Booster


Learn more about
Need a deep-dive on the concept behind this application? Look no further. Learn more about this topic, statistics and related others by exploring similar questions and additional content below.Recommended textbooks for you
Glencoe Algebra 1, Student Edition, 9780079039897…
Algebra
ISBN:
9780079039897
Author:
Carter
Publisher:
McGraw Hill
Glencoe Algebra 1, Student Edition, 9780079039897…
Algebra
ISBN:
9780079039897
Author:
Carter
Publisher:
McGraw Hill