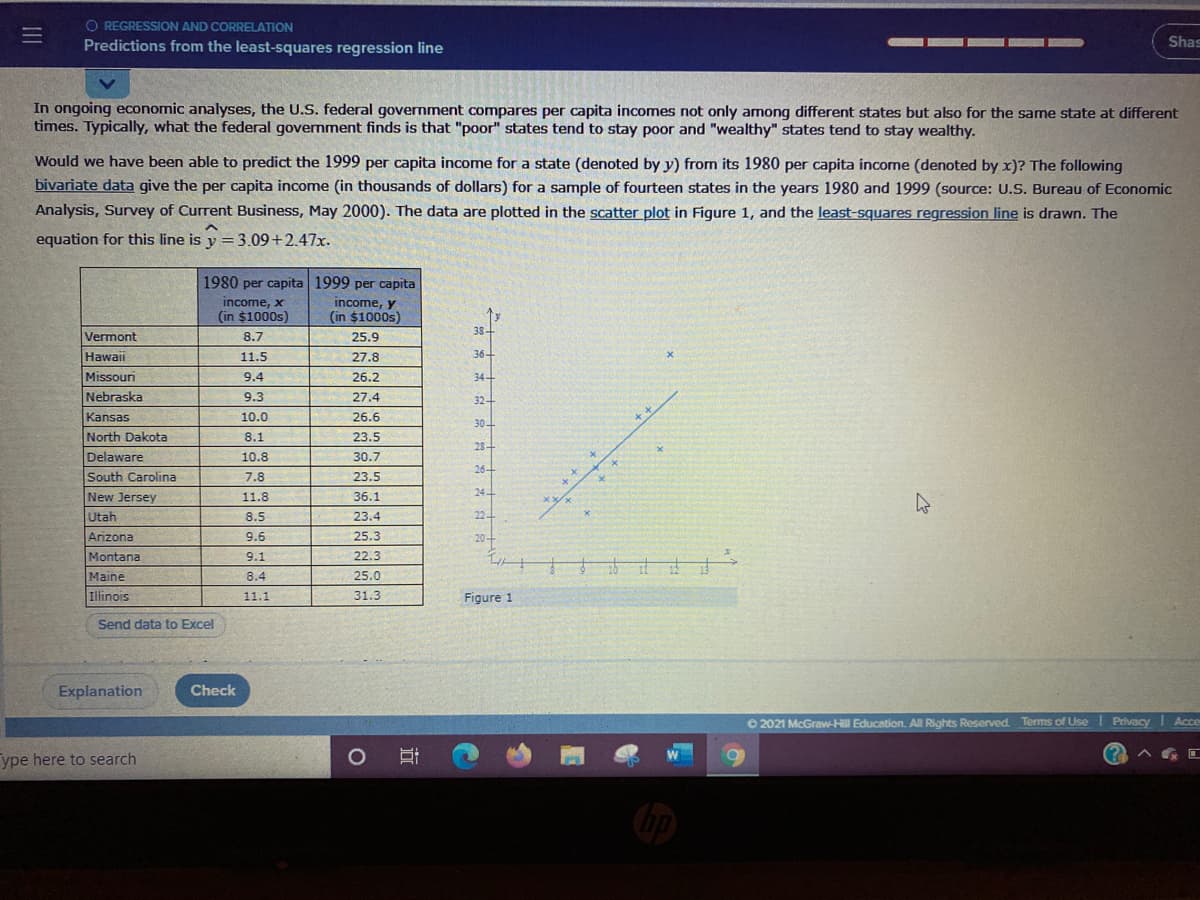
In ongoing economic analyses, the U.S. federal government compares per capita incomes not only among different states but also for the same state at different times. Typically, what the federal government finds is that "poor" states tend to stay poor and "wealthy" states tend to stay wealthy. Would we have been able to predict the 1999 per capita income for a state (denoted by y) from its 1980 per capita income (denoted by x)? The following bivariate data give the per capita income (in thousands of dollars) for a sample of fourteen states in the years 1980 and 1999 (source: U.S. Bureau of Economic Analysis, Survey of Current Business, May 2000). The data are plotted in the scatter plot in Figure 1, and the least-squares regression line is drawn. The equation for this line is y = 3.09+2.47x. 1980 per capita 1999 per capita income, y (in $1000s) income, x (in $1000s) Vermont 8.7 25.9 38- Hawaii 11.5 27.8 36- Missouri 9.4 26.2 34- Nebraska Kansas 9.3 27.4 32- 10.0 26.6 30- North Dakota Delaware South Carolina New Jersey 8.1 23.5 28- 10.8 30.7 26- 7.8 23.5 24 11.8 36.1 Utah Arizona 8.5 23.4 9.6 25.3 Montana 9.1 22.3 Maine 8.4 25.0 Illinois 11.1 31.3 Figure 1 Send data to Excel
In ongoing economic analyses, the U.S. federal government compares per capita incomes not only among different states but also for the same state at different times. Typically, what the federal government finds is that "poor" states tend to stay poor and "wealthy" states tend to stay wealthy. Would we have been able to predict the 1999 per capita income for a state (denoted by y) from its 1980 per capita income (denoted by x)? The following bivariate data give the per capita income (in thousands of dollars) for a sample of fourteen states in the years 1980 and 1999 (source: U.S. Bureau of Economic Analysis, Survey of Current Business, May 2000). The data are plotted in the scatter plot in Figure 1, and the least-squares regression line is drawn. The equation for this line is y = 3.09+2.47x. 1980 per capita 1999 per capita income, y (in $1000s) income, x (in $1000s) Vermont 8.7 25.9 38- Hawaii 11.5 27.8 36- Missouri 9.4 26.2 34- Nebraska Kansas 9.3 27.4 32- 10.0 26.6 30- North Dakota Delaware South Carolina New Jersey 8.1 23.5 28- 10.8 30.7 26- 7.8 23.5 24 11.8 36.1 Utah Arizona 8.5 23.4 9.6 25.3 Montana 9.1 22.3 Maine 8.4 25.0 Illinois 11.1 31.3 Figure 1 Send data to Excel

Linear Algebra: A Modern Introduction
4th Edition
ISBN:9781285463247
Author:David Poole
Publisher:David Poole
Chapter4: Eigenvalues And Eigenvectors
Section4.6: Applications And The Perron-frobenius Theorem
Problem 22EQ

Related questions
Question
I keep getting the answers incorrect
Transcribed Image Text:O REGRESSION AND CORRELATION
三I
Predictions from the least-squares regression line
Shas
In ongoing economic analyses, the U.S. federal government compares per capita incomes not only among different states but also for the same state at different
times. Typically, what the federal government finds is that "poor" states tend to stay poor and "wealthy" states tend to stay wealthy.
Would we have been able to predict the 1999 per capita income for a state (denoted by y) from its 1980 per capita income (denoted by x)? The following
bivariate data give the per capita income (in thousands of dollars) for a sample of fourteen states in the years 1980 and 1999 (source: U.S. Bureau of Economic
Analysis, Survey of Current Business, May 2000). The data are plotted in the scatter plot in Figure 1, and the least-squares regression line is drawn. The
equation for this line is y = 3.09+2.47x.
1980 per capita 1999 per capita
income, x
(in $1000s)
income, y
(in $1000s)
Vermont
38+
8.7
25.9
Hawaii
11.5
27.8
36+
Missouri
9.4
26.2
34+
Nebraska
9.3
27.4
32+
Kansas
10.0
26.6
30+
North Dakota
8.1
23.5
28+
Delaware
10.8
30.7
26+
South Carolina
7.8
23.5
24-
New Jersey
Utah
11.8
36.1
8.5
23.4
22
Arizona
9.6
25.3
20-
Montana
9.1
22.3
Maine
8.4
25.0
Illinois
11.1
31.3
Figure 1
Send data to Excel
Explanation
Check
O 2021 McGraw-Hill Education. All Rights Reserved Terms of Use Privacy Acce
ype here to search
O
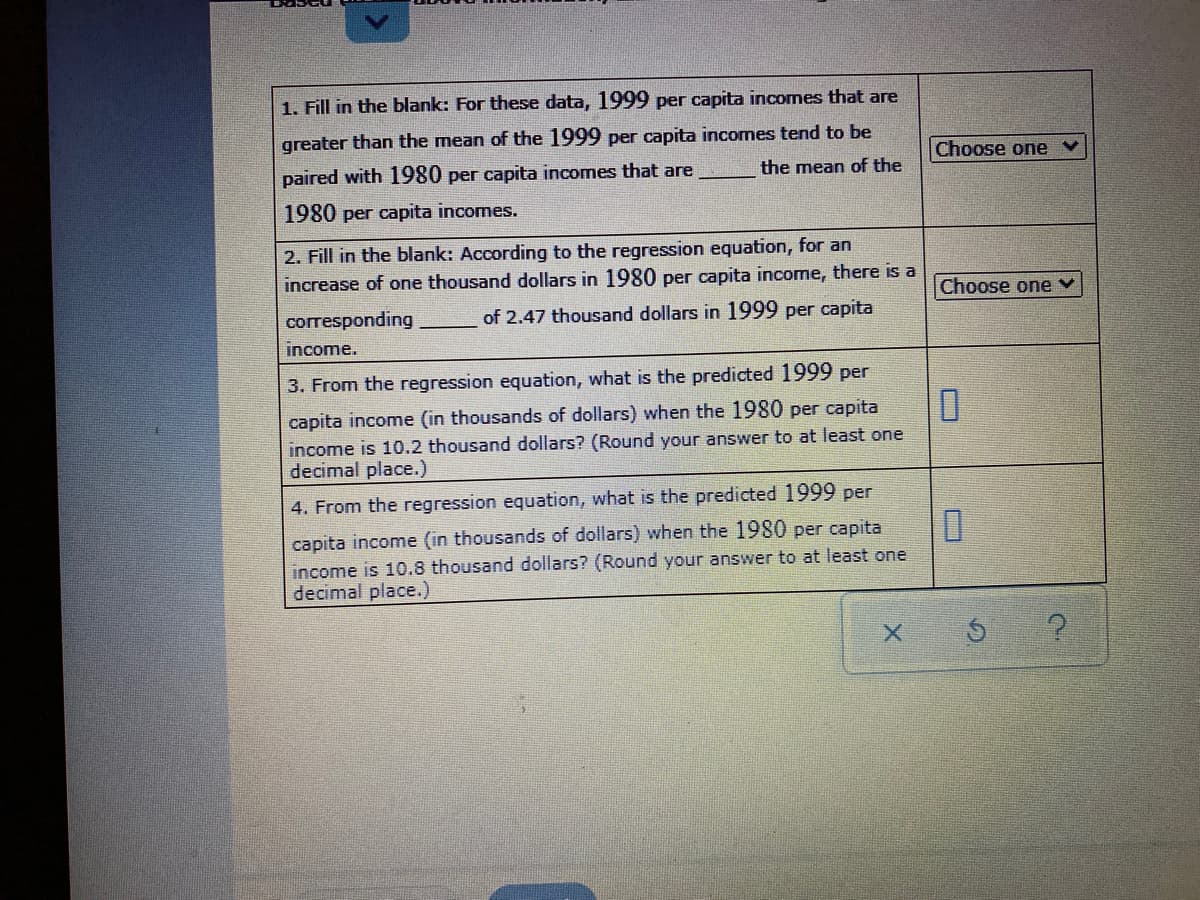
Transcribed Image Text:1. Fill in the blank: For these data, 1999 per capita incomes that are
greater than the mean of the 1999 per capita incomes tend to be
Choose one
paired with 1980 per capita incomes that are
the mean of the
1980 per capita incomes.
2. Fill in the blank: According to the regression equation, for an
increase of one thousand dollars in 1980 per capita income, there is a
Choose one
corresponding
of 2.47 thousand dollars in 1999 per capita
income.
3. From the regression equation, what is the predicted 1999 per
capita income (in thousands of dollars) when the 1980 per capita
income is 10.2 thousand dollars? (Round your answer to at least one
decimal place.)
4. From the regression equation, what is the predicted 1999 per
capita income (in thousands of dollars) when the 1980 per capita
income is 10.8 thousand dollars? (Round your answer to at least one
decimal place.)
Expert Solution
This question has been solved!
Explore an expertly crafted, step-by-step solution for a thorough understanding of key concepts.

This is a popular solution!

Trending now
This is a popular solution!

Step by step
Solved in 2 steps with 1 images

Knowledge Booster


Learn more about
Need a deep-dive on the concept behind this application? Look no further. Learn more about this topic, statistics and related others by exploring similar questions and additional content below.Recommended textbooks for you
Linear Algebra: A Modern Introduction
Algebra
ISBN:
9781285463247
Author:
David Poole
Publisher:
Cengage Learning

Functions and Change: A Modeling Approach to Coll…
Algebra
ISBN:
9781337111348
Author:
Bruce Crauder, Benny Evans, Alan Noell
Publisher:
Cengage Learning

Linear Algebra: A Modern Introduction
Algebra
ISBN:
9781285463247
Author:
David Poole
Publisher:
Cengage Learning
Functions and Change: A Modeling Approach to Coll…
Algebra
ISBN:
9781337111348
Author:
Bruce Crauder, Benny Evans, Alan Noell
Publisher:
Cengage Learning

Big Ideas Math A Bridge To Success Algebra 1: Stu…
Algebra
ISBN:
9781680331141
Author:
HOUGHTON MIFFLIN HARCOURT
Publisher:
Houghton Mifflin Harcourt