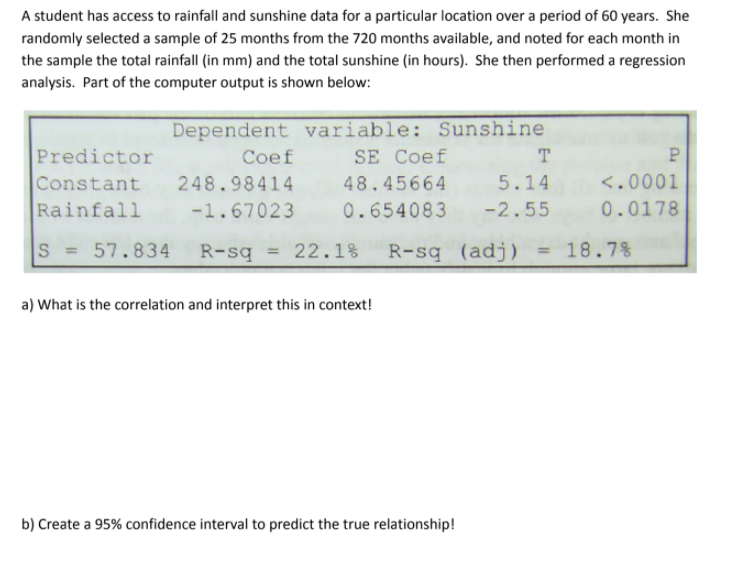
A student has access to rainfall and sunshine data for a particular location over a period of 60 years. She randomly selected a sample of 25 months from the 720 months available, and noted for each month in the sample the total rainfall (in mm) and the total sunshine (in hours). She then performed a regression analysis. Part of the computer output is shown below:
Q: The table contains the state population and the number of licensed drivers in the state (both in…
A: Since, the student has mentioned to solve part C, so we are solve accordingly only part C.
Q: The given paired data lists the heights (in inches) of various males who were measured on their…
A: Given that ; X Y X \cdot YX⋅Y X^2X2 Y^2Y2 52 69 3588 2704 4761 50 66 3300 2500 4356…
Q: For a multiple regression model, SSR = 600 and SSE = 200. The multiple coefficient of determination…
A: Givensum of squares of Residuals(SSR)=600sum of squared estimated of errors(SSE)=200
Q: The following table displays the mathematics test scores for a random sample of college students,…
A:
Q: Find the regression equation for the following paired data. (1, 2), (3, 7), (5, 9), (9, 15), (4, 7)…
A:
Q: The figure shown to the right contains a scatter plot of 10 data points for trees, where the…
A: topic - linear equations
Q: Use the given data to find the equation of the regression line. Examine the scatterplot and identify…
A: In simple linear regression there will be only one independent variable. In multiple linear…
Q: An independent researcher is interested in finding out whether there exists a positive relationship…
A:
Q: An agricultural experimenter divided a tract of land into seven plots of equal size. Each plot was…
A: 3.0 53 159 9 3.5 57 199.5 12.25 4.0 56 224 16 4.5 54 243 20.25 5.0 62 310 25 5.5 59 324.5…
Q: The number of initial public offerings of stock issued in a 10-year period and the total proceeds of…
A: (a). Given, n=10 The table below shows the required calculation: x y xy x2 y2 415 18867…
Q: Use the sample data given in table x 1 2 3 4 5 y 3 4 1 2 1 a) To Write the regression equation…
A: Given Data : X Y 1 3 2 3 3 1 4 2 5 1 Below table will be used to calculate the…
Q: The data below are the temperatures on randomly chosen days during a summer class and the number of…
A: Given data is Temperature x 72 85 91 90 88 98 75 100 80 No. of absences y 3 7 10 10 8 15 4 15 5
Q: The grades of a selected 9 students of Math 122 class on a midterm report and on the final report…
A: Hi! Thank you for the question, As per the honor code, we are allowed to answer three sub-parts at a…
Q: The following table contains data regarding golf scores and the average lengths of drives (in yards)…
A: From the statistical software we get the output as follows,
Q: A random sample of twelve students were chosen, and their midterm test score (y), as- signment score…
A: Given, Midterm Score, y Assignment Score, x1 Classes Missed, x2 85 74 76 90 85 87 94 98…
Q: A teacher measured the hours of study of seven students in one week and compared the re with their…
A: Consider, x y x^2 y^2 xy 24 90 576 8100 2160 19 92 361 8464 1748 28 100 784 10000 2800…
Q: Show that the following relationship on the simple linear regression class notebook is true: i=1
A: The given expression is ∑i=1nxiyi-nX¯ Y¯∑i=1nxi2-nX¯2=∑i=1nxi-X¯ yi-Y¯∑i=1nxi-X¯2, here,…
Q: a) The grades of a class of 9 students on a mid term report(X) and the final examination(Y) are as…
A: (a) Let X denote the Mid term report Let Y denote the final examination Calculation: From the…
Q: Suppose that a researcher selects a random sample of 200 columnists from a large newspaper company…
A: Given: n=200 ρ=0.72
Q: The following table shows the annual family income of the students enrolled in the JRMSU-TC and…
A: Solution-: Let, X=Annual family income (Pesos) (in '000) and Y=General weighted average (%) We have…
Q: Use the given data to find the equation of the regression line. Round the final values to three…
A: In this case x is the independent variable and y is the dependent variable.
Q: A high school administrator is interested in determining the relationship between high school…
A:
Q: Find the equation of the regression line for the given data. -5 -3 4 -1 -2 3 11 -6 3 -4 -5 8. =…
A: The regression equation for one independent variable is, From the given information, Let X…
Q: An independent researcher is interested in finding out whether there exists a positive relationship…
A: A statistical regression model in its analysis may sometimes exclude one or more of the relevant…
Q: Eight students are selected randomly, and their present graduate GPA is compared to thei…
A: For the given data has to find ( a) Regression equation ( b ) Hypothesis test for Regression
Q: Find the equation of the regression line for the given data. x -5 -3 4 1-1 -2 0 2 3-4 y -10 -8 91-2…
A: Find Regression line equations from the following data X Y -5 -10 -3 -8 4 9 1 1 -1 -2…
Q: An agent for a real estate company in a large city would like to be able to predict the monthly…
A: Using Excel > data > Data analysis > regression, we get:
Q: The number of initial public offerings of stock issued in a 10-year period and the total proceeds of…
A: Obtain the value of the standard error of estimate. The value of the standard error of estimate…
Q: The table below is a record of the number of miles driven between stops for gas and the amount of…
A: Regression analysis is the measure of the average relationship between two or more variables in…
Q: A student has access to rainfall and sunshine data for a particular location over a period of 60…
A: a) From the given output, the value of R-square is 22.1%. That is, r2=22.1% =0.221r=0.221…
Q: Find a linear regression model for the weekly cost data, using z as the independent variable. C(x) =…
A: Given information: Given data represents the values of the variables x = sleeping bags, p = price…
Q: A researcher collected statistics on the sales amount of a product in 120 different markets and the…
A: 1) b) In your opinion, which variable should this researcher choose as an independent variable to…
Q: (a) Calculate A, B, C, D and E. (b) At a = 0.05 test whether the regression model are fit.
A: The Analysis of variance for the simple linear regression table is given.
Q: The grades of a sample of 9 students on a prelim exam (x) and on the midterm exam (y) are shown…
A: Given that, The grades of a sample of 9 students on a prelim exam (x) and on the midterm exam (y)…
Q: The table contains the state population and the number of licensed drivers in the state (both in…
A: The equation for the model is given as, y=0.75x Where, y=No.of licenced drivers…
Q: y 96 99 81 47 71 78 72 34 50 66 94 85 77 82 99 99 67 68
A:
Q: The number of initial public offerings of stock issued in a 10-year period and the total proceeds of…
A: SOLUTION
Q: Use the given data to find the equation of the regression line. Examine the scatterplot and identify…
A: Given data, X Y X*Y X*X 13 11.54 150.02 169 11 12.06 132.66 121 7 8.86 62.02 49 10…
Q: The following table shows the approximate number of wireless telephone subscriptions in recent…
A: The following table shows the approximate number of wireless telephone subscriptions in recent…
Q: In order to determine the relationship between the number of units sold of a company's product (y)…
A: Given: Number of units sold y = 550 , 545, 540, 600, 600, 510, 570, 650, 615 Competitor price x1=…
Q: The following table shows the annual expenditures, in dollars, per customer unit for residential…
A: Given: The following table shows the annual expenditures, in dollars, per residential landline phone…
Q: Calculate the estimated multiple linear regression equation for the following data using the…
A: Regression measures linear relationship between independent variables(explanatory variable) and…
Q: Using the same set of data as questions 4 and 5, what would be the "a" coefficient be if we force…
A: Regression expresses the relationship between variables in the form of equation. Y=a+bX where,…
Q: The table below shows the number of state-registered automatic weapons and the murder rate for…
A:
Q: The admissions officer for a certain college developed the following estimated regression equation…
A: As the multiple linear regression equation is given by, ŷ = −1.39 + 0.0234x1 + 0.00482x2 where A…
Q: In multiple regression, when all independent variables are considered but the order in which they…
A: Stepwise Regression: At each step of a stepwise regression, a variable is considered for addition to…
Q: Is there a significant relationship between an individual's income and the set of variables, age,…
A: Given is a linear regression analysis where the dependent variable is individual's income and…
Q: An agent for a real estate company in a large city would like to be able to predict the monthly…
A: Use EXCEL to obtain the value correlation coefficient. EXCEL procedure: Go to EXCEL Go to…
Q: Find the equation of the regression line for the given data. -3 -6 = -2.097x + 0.206 %3D = 0.206x -…
A:
All parts-Please define variables and everything.
Trending now
This is a popular solution!
Step by step
Solved in 2 steps with 2 images
- A seafood-sales manager collected data on the maximum daily temperature, T, and the daily revenue from salmon sales, R, using sales receipts for 30 days selected at random. Using the data, the manager conducted a regression analysis and found the least-squares regression line to be Rˆ=126+2.37T. A hypothesis test was conducted to investigate whether there is a linear relationship between maximum daily temperature and the daily revenue from salmon sales. The standard error for the slope of the regression line is SEb1=0.65. Assuming the conditions for inference have been met, which of the following is closest to the value of the test statistic for the hypothesis test? t=0.274 A t=0.65 B t=1.54 C t=3.65 D t=193.85 EWhich of the following does not need to be computed to determine a simple regression line? SSx SP "Y-hat" SSyWhich of the multivariate regression parameters listed below would be best interpreted as: the predicted value on the dependent variable when all of the independent variables in the model are equal to zero. a b1 X1 R2
- Use the table of x and y values below to determine the slope of the least-squares regression line.Interpret the estimated regression coefficient corresponding to the Z variable. Data Salary Education Experience Sex 29.7985 15 3 1 21.8219 4 0 0 22.8978 4 0 0 22.0917 1 1 0 21.8993 5 0 0 22.4829 3 1 1 28.0772 15 0 0 y=salary 23.6292 6 1 1 x1=education level in schooling years 32.3595 0 15 1 x2=experience level in employment level 21.794 1 0 0 d=sex (1 for male,0 for female) 19.8762 3 0 0 Ln(Y) = alpha +beta1X1 +Beta2X2+ Beta3D +Beta4Z +e 21.0253 3 0 0 where z =X2D 24.6323 0 5 1 19.0247 0 0 0 18.8857 0 0 0 21.8552 1 0 0 24.2675 6 1 0 18.7931 0 0 0 18.9276 0 0 0 23.4441 5 1 1 20.8047 2 0 0 18.26 0 0 0 20.6726 0 2 1 21.7815 3 0 0…Years of Work Experience and number of Job Offers of 10 job-seekers were as follows: Work Exp. 4 2 5 3 7 12 2 5 4 9 No. of Offers 7 1 8 4 13 19 3 11 9 15 a. Fit the regression equation of No. of Job Offers on Years of Work Experience. b. What will be the predicted number of offers for an applicant with 6 years of experience? c. Verify the relationship between the number of job offers and years of work experience using at least two relevant methods
- A student used multiple regression analysis to study how family spending (y) is influenced by income(x1), family size (x2), and additionsto savings(x3). The variables y, x1, and x3 are measured in thousandsof dollars. The following results were obtained.ANOVAdf SSRegression 3 45.9634Residual 11 2.6218TotalCoefficients Standard ErrorIntercept 0.0136x10.7992 0.074x20.2280 0.190x3-0.5796 0.920 Carry out a test to see if x3 and y are significantly related. Use a 5% level of significance.A student used multiple regression analysis to study how family spending (y) is influenced by income(x1), family size (x2), and additionsto savings(x3). The variables y, x1, and x3 are measured in thousandsof dollars. The following results were obtained.ANOVAdf SSRegression 3 45.9634Residual 11 2.6218TotalCoefficients Standard ErrorIntercept 0.0136x10.7992 0.074x20.2280 0.190x3-0.5796 0.920 Carry out a test to determine whether y is significantly related to the independent variables.Use a 5% level of significance.A researcher collected data on the cholesterol level, CC, and the age, AA, of 24 people selected at random. Using the data, the researcher calculated the least-squares regression line to be Cˆ=182+2.2AC^=182+2.2A and the standard error of the slope to be 0.38. If the conditions for inference are met, which of the following is closest to the value of the test statistic to test the hypotheses H0:β=0H0:β=0 versus Ha:β≠0Ha:β≠0 ?
- The marketing manager of a supermarket chain would like to determine the effect of shelf spaceon the sales of pet food. A random sample of 10 stores was selected, and the results are presentedbelow. Store shelf space in cm weekly sales in thousand pesos 1 45 18 2 45 21 3 75 15 4 80 18 5 95 23 6 100 26 7 135 22 8 140 27 9 185 25 10 190 28 d. Using the estimated simple linear regression equation Y=15.6414+0.0611X, estimate the weekly sales when theshelf space is 230cm? 250cm? e. Compute the coefficient of determination and interpret its value.Use the following results obtained from a simple linear regression analysis with 12 observations. Y = 37.2895- (1.2024)X Sb = 0.2934 Test to determine if there is a significant negative relationship between the independent and dependent variables at alpha= .05. Give the resulting conclusion. a. is rejected. B.cannot be tested with the given information. c. is not rejected. D. is not an appropriate null hypothesis for this situation.Using 25 observations on each variable, a computer program generated the following multiple regression model: yhat=69.2+2.87x1+5.81x21.83x3 If the standard errors of the coefficients of the independent variables are, respectively, 1.34, 4.84, and 0.70, can you conclude that the independent variable x1 is needed in the regression model? Let β1, β2, and β3 denote the coefficients of the 3 variables in this model, and use a two-sided hypothesis test and significance level of 0.05 to determine your answer. Carry your intermediate computations to at least three decimal places and round your answers as specified in the table. The null hypothesis: H0: The alternative hypothesis: H1: The type of test statistic: (Choose one)ZtChi squareF The value of the test statistic:(Round to at least two decimal places.) The two critical values at the 0.05 level of significance:(Round to at least two decimal places.) and Can you…