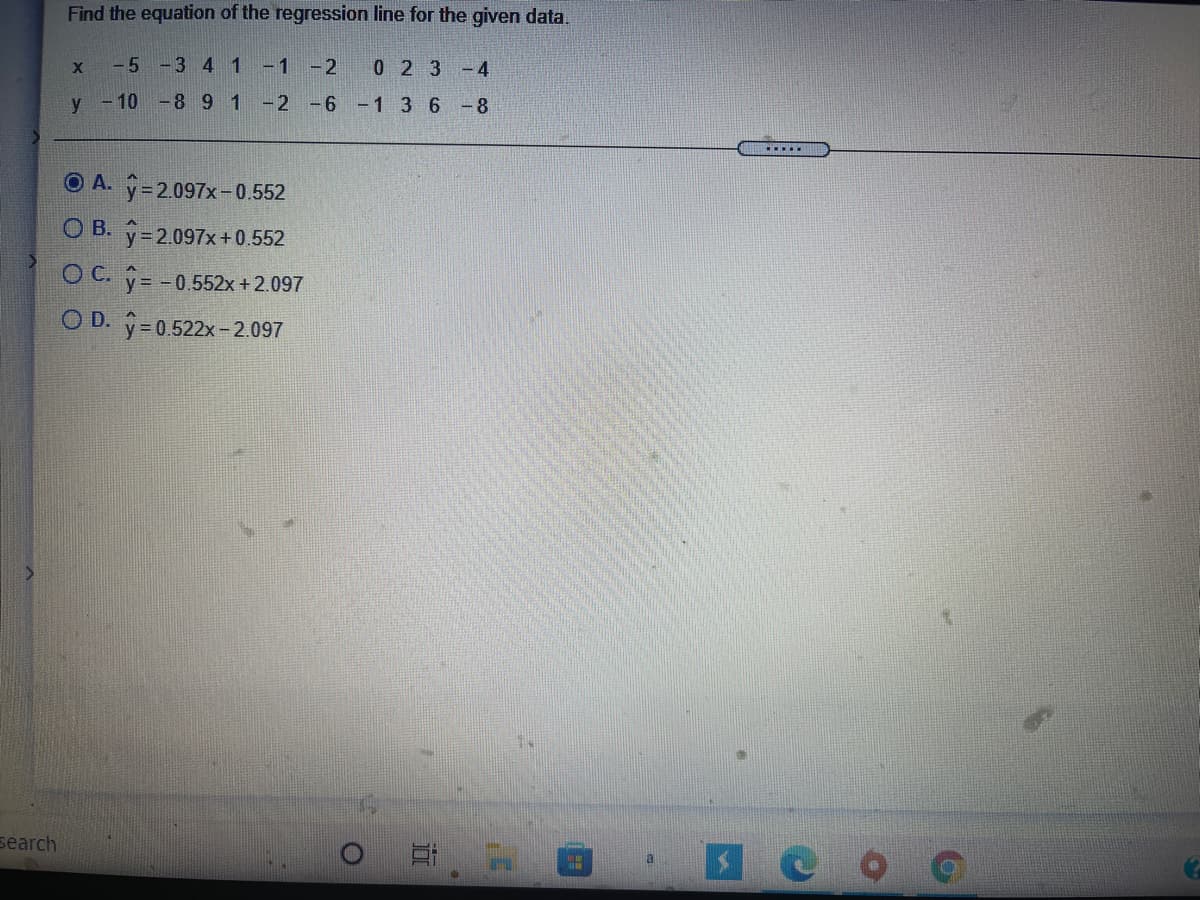
Find the equation of the regression line for the given data. x -5 -3 4 1-1 -2 0 2 3-4 y -10 -8 91-2 -6 -1 3 6 -8 O A. y=2.097x-0.552 O B. y=2.097x+0.552 O C. y= -0.552x +2.097 %3D


Q: Consider the following output for a linear regression: The regression equation is In(y) = 7.55 -…
A:
Q: model involving 30 observations, the following estimated regression equation was obtained. ŷ = 170…
A: We know that the regression model is y^=β0+β1x+β2x2 where β0 is constant β1 is the coefficient on…
Q: In fitting a multiple linear regression model of the form: E(Y)=B0 +B1X1+B2X2+B3X3, if the observed…
A: Solution: Given information: n= 20 observation k= 3 independent variables SSE= 120 SST=SSyy= 500…
Q: The table below shows the number of state-registered automatic weapons and the murder rate for.…
A:
Q: Find the correlation co-efficient and the equations of regression lines for the following values of…
A:
Q: The amounts (x) of 6 restaurant bills and the corresponding amounts (y) of the tips are given in the…
A:
Q: Given the data as shown in the table below X Y 3.1 10.2 2.6 8.7 3.7 9.1 1.8 7.8 3.4 8.7 The correct…
A:
Q: A customer service department asks its customers to rate their over-the-phone service on a scale…
A: Excel Procedure: Enter x and y in Excel>Data>Data Analysis> ‘Regression’>Select y under…
Q: Which of the following is the best interpretation for the slope of the regression line? (A) An…
A: Given : Constant = 66.42 Slope / Coefficient of Payroll = 0.2070
Q: The data below are the final exam scores of 10 randomly selected statistics students and the number…
A:
Q: Given the data in the table below for the dependent variable Y and independent variables X1, X2, and…
A: Since you have posted a question with multiple sub-parts, we will solve first three subparts for…
Q: Below is an attempt at describing the simple linear regression model, which is incomplete and…
A: Mistake 1: The values of i are considered to be finite till n. Here the value of n is not defined…
Q: Use the given data to find the equation of the regression line. Round the final values to three…
A:
Q: x y 1 10 4 5 5 3.5 7 2 10 1.5 Which description best fits the
A: We have given that data I want to find regression model Y = n + mx Where m = slope , n=…
Q: Given the estimated regression line y= -26 +15 x, and a coefficient of determination R2 =0.25, the…
A:
Q: Use the gi ven data to find the equation of the regression line. Round the final values to three…
A:
Q: The data below are the temperatures on randomly chosen days during a summer class and the number of…
A: Given data is Temperature x 72 85 91 90 88 98 75 100 80 No. of absences y 3 7 10 10 8 15 4 15 5
Q: What type of correlation exists between a person's age and the amount of sleep? O a. high positive O…
A: From the given data Select the correct choice
Q: ... 96 99 81 47 71 78 72 34 50 66 94 85 77 82 99 99 67 68 The grades of a sample of 9 students on a…
A:
Q: Which of the following is a multiple linear regression model? O Y= Bo+B1x + B2x² OY =Bo+B1x O…
A: Let us determine which one of the above is a multiple linear regression model in the next step.
Q: The price X (dollars per pound) and consumption y (in pounds per capita) of beef were samples for 10…
A: Given that,
Q: set of n=15 pairs of scores (X and Y) values produces a regression equations of Y=2X+6. Fin the…
A: Given X scores: 0, 2, 3, and -4 regression equations of Y=2X+6 A set of n=15 pairs of scores (X and…
Q: A set of n = 15 pairs of scores (X & Y values) produces a regression equation of Y = 3X + 8. Find…
A:
Q: Eight students are selected randomly, and their present graduate GPA is compared to thei…
A: For the given data has to find ( a) Regression equation ( b ) Hypothesis test for Regression
Q: The data below are the number of absences and the final grades of 9 randomly selected students from…
A:
Q: The grades of a sample of 9 students on a prelim exam (x) and on the midterm exam (y) are shown…
A: Calculate Fitting a straight line - Curve fitting using Least square method X Y 96 99 81 47…
Q: One of the residuals in a linear regression model is equal to 6.5. Other results from the model…
A: Solution: It is given here: Residual = 6.5 SSE = 182 MSE = 3.2
Q: 4) Use the given data to find the equation of the regression line. Round the final values to three…
A:
Q: The table below shows the number of state-registered automatic weapons and the murder rate for…
A: Solution: Let x= thousands of automatic weapons and y=murders per 100,000 residents. The given table…
Q: The amounts of 6 restaurant bills and the corresponding amounts of the tips are given in the table…
A: X = Bill Y = Tip Count X Y XY X^2 1 97.34 16 1557.44 9475.0756 2 106.27 16 1700.32 11293.3129…
Q: Given that the equation for the regression line is ŷ 0.00683x – 0.03024, what is the residual for…
A: The brain activity for subject 9 is 0.153.
Q: racing bikes. Brand Weight Price ($) A 17.8 2,100 B 16.1 6,350 14.9 8,370 15.9 6,200 17.2 4,000 F…
A:
Q: The data below are the final exam scores of 10 randomly selected history students and the number of…
A:
Q: The data below are the final exam scores of 10 randomly selected history students and the number of…
A: Solution:
Q: 4) Usethe given data to find the equation of the regression line. Round the final valuesto three…
A: ----------------------------------------------------------------------------------------------------…
Q: Given the following information regarding a regression model with Y as dependent variable and X as…
A: The data given in the problem will help in calculating the standard errors of the regression model.…
Q: length,x 1 2 3 4 observed y 4.4 5 6.6 7 predicted y 4.34 5.28 6.22 7.16 calculate the regression…
A: There are many accuracy measures for a regression model to evaluate the performance of a model.…
Q: Given the following data n= 5, Σ x = 15, Σ ( -X)10. Σ (-7- 26, Σ ( ΧYY-= 13 Compute the…
A: Given n=5, ∑x=15, ∑y=20, ∑X-X¯2=10, ∑Y-Y¯2=26, ∑X-X¯Y-Y¯=13
Q: *Consider the following table, and answer the following Two questions Q8. Find the linear regression…
A: Note: According to Bartleby expert guidelines, we can answer only first question with their three…
Q: If a correlation is r= 0.00, then SP = 0 and the regression equation is O Ý =X +0 O Ý =X + X O Ý =0…
A: Given: correlation is r = 0.00, then SP = 0
Q: Using the same set of data as questions 4 and 5, what would be the "a" coefficient be if we force…
A: Regression expresses the relationship between variables in the form of equation. Y=a+bX where,…
Q: 4) Use the given data to find the equation of the regression line. Round the final values to three…
A: From the provided information, x 6 8 20 28 36 y 2 4 13 20 30
Q: Given: Student Pre-test Scores Post-test Scores 1 84 85 2 78 86 ITT 3 88 89 4 79 83 5 84 87 Find:…
A:
Q: Given the data as shown in the table below 3.8 9.8 2.5 8.8 4.1 9.7 0.9 7.5 2.4 9.6 The correct…
A: egression line equations from the following data X Y 3.8 9.8 2.5 8.8 4.1 9.7 0.9 7.5…
Q: 18. Give the following data, which is the equation of the regression line? 3 12 2 6. 12 c. y = 4.98…
A: Note : We’ll answer the first question since the exact one wasn’t specified. Please submit a new…
Q: 4) How to conduct multiple regression in Excel (Provide the steps)? Driving Experience (years)…
A:
Q: Given that the equation of a regression line is y = 3.5x-5.4, what is the best predicted value for y…
A: Given, Y⏞=3.5X-5.4X=-1.2
Q: The regression line for the given data is v = -1.885x + 0.758. Determine the residual of a data…
A: We have given that the regression line for the data is: y^ = -1.885 + 0.758 Residual = y - y^
Q: In a statistics course, a linear regression equation was computed to predict the final exam score…
A: The regression equation is given as: y^=10+0.9x y = final exam score x represents the mid term score


Trending now
This is a popular solution!

Step by step
Solved in 2 steps

- The following fictitious table shows kryptonite price, in dollar per gram, t years after 2006. t= Years since 2006 0 1 2 3 4 5 6 7 8 9 10 K= Price 56 51 50 55 58 52 45 43 44 48 51 Make a quartic model of these data. Round the regression parameters to two decimal places.Olympic Pole Vault The graph in Figure 7 indicates that in recent years the winning Olympic men’s pole vault height has fallen below the value predicted by the regression line in Example 2. This might have occurred because when the pole vault was a new event there was much room for improvement in vaulters’ performances, whereas now even the best training can produce only incremental advances. Let’s see whether concentrating on more recent results gives a better predictor of future records. (a) Use the data in Table 2 (page 176) to complete the table of winning pole vault heights shown in the margin. (Note that we are using x=0 to correspond to the year 1972, where this restricted data set begins.) (b) Find the regression line for the data in part ‚(a). (c) Plot the data and the regression line on the same axes. Does the regression line seem to provide a good model for the data? (d) What does the regression line predict as the winning pole vault height for the 2012 Olympics? Compare this predicted value to the actual 2012 winning height of 5.97 m, as described on page 177. Has this new regression line provided a better prediction than the line in Example 2?41. Which of the following is the multiple regression model for the data? (a) y = -0.11050 + 2.10797x1 + 0.40717x2 (b) y = -0.11050 + 0.40717x1 + 2.10797x2 (c) y = 0.23563 + 0.00062x1 + 0.23626x2 (d) none (e) y = -0.44187 + 2.42120x1 + 0.36135x2
- In the following case find the best predicted value of y given the following: x = 2.00, r = -0.123 (p-value = 0.62), y (bar)= 8.00, n = 30 and the equation of the regression line is: y (hat) = 7.00 - 2.00xThe grades of a sample of 9 students on a prelim exam (x) and on the midterm exam (y) are shown below. Find the regression equation. y = 34.661 + 0.433x y = 0.777 + 12.0623x y = 12.0623 + 0.777x y = 34.661 - 0.433xThe personnel director of a large hospital is interested in determining the relationship (if any) between an employee’s age and the number of sick days the employee takes per year. The director randomly selects ten employees and records their age and the number of sick days which they took in the previous year. Employee 1 2 3 4 5 6 7 8 9 10Age 30 50 40 55 30 28 60 25 30 45Sick Days 7 4 3 2 9 10 0 8 5 2 The estimated regression equation and the standard error are given. Sick Days=14.310162−0.236900(Age) Se=1.682207 Find the 95% prediction interval for the average number of sick days an employee will take per year, given the employee is 34 . Round your answer to two decimal places.
- Suppose you are given the following x and y values. Assume x is the independent variable and y the dependent variable. x y 13 10 10 11 3 4 29 23 5 8 25 21 8 10 17 15 19 17 31 29 23 24 What is the regression equation? Group of answer choices 2.5296x + 0.7878 0.7878x 2.5296 + 0.7878y 2.5296 + 0.7878xWhich of the following represents the least-square regression line's equation? A. y = -a - bx B. y = a + bx C. y = a - bx D. y = -a + bx(a) Find the equation of the regression line for the given data, letting Row 1 represent the x-values and Row 2 the y-values. Sketch a scatter plot of the data and draw the regression line. B.) Find the equation of the regression line for the given data, letting Row 2 represent the x-values and Row 1 the y-values. Sketch a scatter plot of the data and draw the regression line. C.)What effect does switching the explanatory and response variables have on the regression line? Compare the slopes and y-intercepts of the two lines and see if anything has changed.
- A customer service department asks its customers to rate their over-the-phone service on a scale of 1-20 immediately after their service has been completed. The department then matches each customer's rating, y, with the number of minutes the person waited on hold, x. The accompanying table shows the ratings and number of minutes on hold for 10 randomly selected customers. The regression line for the data is y=16.5445−0.3073x, x=4.7, ∑x2=285, and SSE=62.8456. Minutes Rating 3 14 8 13 1 18 4 10 6 15 2 17 9 15 4 20 7 15 3 14 α=0.05 What is the test statistic for the hypothesis test? t= (Round to two decimal places as needed.)The amounts (x) of 6 restaurant bills and the corresponding amounts (y) of the tips are given in the table below. Bill 64.30 32.98 88.01 97.34 52.44 49.72 Tip 7.70 4.50 10.00 16.00 7.00 5.28 Find the following: The regression equation is ?̂=___+ ___x. If the amount of the bill is $85 the best prediction for the amount of the tip is

