A student used a pH meter to collect data for the titration of an unknown concentration of propanoic acid with a 0.150 mol/L solution of sodium hydroxide. The data table from the investigation is shown in the table below. Data for the Titration of Propanoic Acid with Sodium Hydroxide Volume of propanoic acid: 25.00 mL [NaOH] = 0.150 mol/L Volume of NaOH (aq) added (mL) 0.00 2.00 4.11 7.98 11.95 14.08 16.05 17.00 17.21 17.39 17.62 17.99 18.18 18.39 18.80 20.00 22.03 PH 2.83 3.84 4.20 4.64 5.03 5.27 5.61 5.90 6.00 6.09 6.23 6.74 8.80 10.92 12.24 12.56 12.69 Adobe S4343625416 0..
A student used a pH meter to collect data for the titration of an unknown concentration of propanoic acid with a 0.150 mol/L solution of sodium hydroxide. The data table from the investigation is shown in the table below. Data for the Titration of Propanoic Acid with Sodium Hydroxide Volume of propanoic acid: 25.00 mL [NaOH] = 0.150 mol/L Volume of NaOH (aq) added (mL) 0.00 2.00 4.11 7.98 11.95 14.08 16.05 17.00 17.21 17.39 17.62 17.99 18.18 18.39 18.80 20.00 22.03 PH 2.83 3.84 4.20 4.64 5.03 5.27 5.61 5.90 6.00 6.09 6.23 6.74 8.80 10.92 12.24 12.56 12.69 Adobe S4343625416 0..

Chemistry: Principles and Practice
3rd Edition
ISBN:9780534420123
Author:Daniel L. Reger, Scott R. Goode, David W. Ball, Edward Mercer
Publisher:Daniel L. Reger, Scott R. Goode, David W. Ball, Edward Mercer
Chapter16: Reactions Between Acids And Bases
Section: Chapter Questions
Problem 16.102QE

Related questions

Question
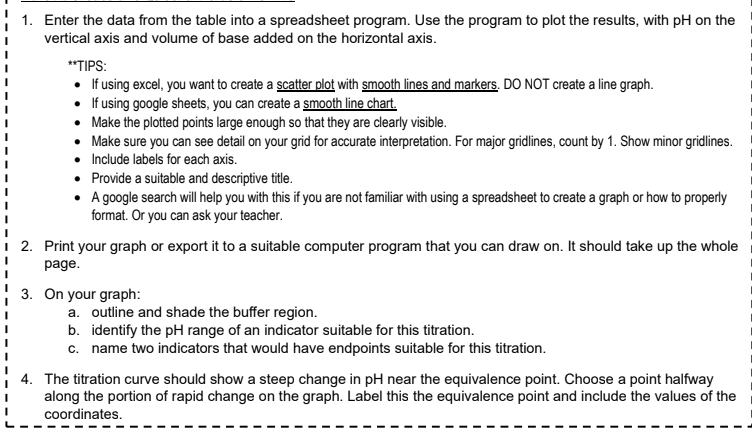
Transcribed Image Text:1. Enter the data from the table into a spreadsheet program. Use the program to plot the results, with pH on the
vertical axis and volume of base added on the horizontal axis.
**TIPS:
• If using excel, you want to create a scatter plot with smooth lines and markers. DO NOT create a line graph.
• If using google sheets, you can create a smooth line chart.
•
Make the plotted points large enough so that they are clearly visible.
Make sure you can see detail on your grid for accurate interpretation. For major gridlines, count by 1. Show minor gridlines.
• Include labels for each axis.
•
Provide a suitable and descriptive title.
•
A google search will help you with this if you are not familiar with using a spreadsheet to create a graph or how to properly
format. Or you can ask your teacher.
2. Print your graph or export it to a suitable computer program that you can draw on. It should take up the whole
page.
3. On your graph:
a. outline and shade the buffer region.
b. identify the pH range of an indicator suitable for this titration.
c. name two indicators that would have endpoints suitable for this titration.
4. The titration curve should show a steep change in pH near the equivalence point. Choose a point halfway
along the portion of rapid change on the graph. Label this the equivalence point and include the values of the
coordinates.
![A student used a pH meter to collect data for the titration of an unknown concentration of propanoic acid with a
0.150 mol/L solution of sodium hydroxide. The data table from the investigation is shown in the table below.
Data for the Titration of Propanoic Acid with Sodium Hydroxide
Volume of propanoic acid: 25.00 mL
[NaOH] = 0.150 mol/L
Volume of NaOH (aq)
added (mL)
0.00
2.00
4.11
7.98
11.95
14.08
16.05
17.00
17.21
17.39
17.62
17.99
18.18
18.39
18.80
20.00
22.03
PH
2.83
3.84
4.20
4.64
5.03
5.27
5.61
5.90
6.00
6.09
6.23
6.74
8.80
10.92
12.24
12.56
12.69
Adobe S4343625416
0..](/v2/_next/image?url=https%3A%2F%2Fcontent.bartleby.com%2Fqna-images%2Fquestion%2F3611f98b-e0a7-49c7-b7ad-b5d4e3b7c968%2F63c1c3e6-f0e0-4f70-9b67-2bf736cc8c34%2Fz1yyi6l_processed.png&w=3840&q=75)
Transcribed Image Text:A student used a pH meter to collect data for the titration of an unknown concentration of propanoic acid with a
0.150 mol/L solution of sodium hydroxide. The data table from the investigation is shown in the table below.
Data for the Titration of Propanoic Acid with Sodium Hydroxide
Volume of propanoic acid: 25.00 mL
[NaOH] = 0.150 mol/L
Volume of NaOH (aq)
added (mL)
0.00
2.00
4.11
7.98
11.95
14.08
16.05
17.00
17.21
17.39
17.62
17.99
18.18
18.39
18.80
20.00
22.03
PH
2.83
3.84
4.20
4.64
5.03
5.27
5.61
5.90
6.00
6.09
6.23
6.74
8.80
10.92
12.24
12.56
12.69
Adobe S4343625416
0..
Expert Solution
This question has been solved!
Explore an expertly crafted, step-by-step solution for a thorough understanding of key concepts.

This is a popular solution!

Trending now
This is a popular solution!

Step by step
Solved in 3 steps with 2 images

Knowledge Booster


Learn more about
Need a deep-dive on the concept behind this application? Look no further. Learn more about this topic, chemistry and related others by exploring similar questions and additional content below.Recommended textbooks for you
Chemistry: Principles and Practice
Chemistry
ISBN:
9780534420123
Author:
Daniel L. Reger, Scott R. Goode, David W. Ball, Edward Mercer
Publisher:
Cengage Learning

Chemistry: The Molecular Science
Chemistry
ISBN:
9781285199047
Author:
John W. Moore, Conrad L. Stanitski
Publisher:
Cengage Learning

Chemistry
Chemistry
ISBN:
9781305957404
Author:
Steven S. Zumdahl, Susan A. Zumdahl, Donald J. DeCoste
Publisher:
Cengage Learning
Chemistry: Principles and Practice
Chemistry
ISBN:
9780534420123
Author:
Daniel L. Reger, Scott R. Goode, David W. Ball, Edward Mercer
Publisher:
Cengage Learning
Chemistry: The Molecular Science
Chemistry
ISBN:
9781285199047
Author:
John W. Moore, Conrad L. Stanitski
Publisher:
Cengage Learning
Chemistry
Chemistry
ISBN:
9781305957404
Author:
Steven S. Zumdahl, Susan A. Zumdahl, Donald J. DeCoste
Publisher:
Cengage Learning

Chemistry & Chemical Reactivity
Chemistry
ISBN:
9781337399074
Author:
John C. Kotz, Paul M. Treichel, John Townsend, David Treichel
Publisher:
Cengage Learning

Chemistry & Chemical Reactivity
Chemistry
ISBN:
9781133949640
Author:
John C. Kotz, Paul M. Treichel, John Townsend, David Treichel
Publisher:
Cengage Learning