A student was interested in the impact of nutrition and exercise on mental health. She recruited a sample of 80 individuals. She divided the participants into 4 groups. One group was a control group There was no treatment for this group. The second group was the diet group. These participants followed a strict diet that was designed by a dietitian. The nutrients in the diet were optimized for each individual, The third group was an exercise group. These participants worked with a personal trainer on an individualized exercise plan. The fourth group was the exercise and diet group. This group had both the dietitian and personal trainer intervention. After 3 weeks of treatment (or control), She measured their mental health with the Warwick-Edinburgh Mental Well-being Scale (WEMWBS), Some of the information is included in the ANOVA table below but I spilled a coffee on the output and the student already deleted the raw data... oh, no!! Given the ANOVA table below, what is the F-statistic? Source ss df MS F Between 1200.00 1800.00 Within Total OF= 9 50 OF = 19.00 OF= 12.67 O There is not enough information to determine F.
A student was interested in the impact of nutrition and exercise on mental health. She recruited a sample of 80 individuals. She divided the participants into 4 groups. One group was a control group There was no treatment for this group. The second group was the diet group. These participants followed a strict diet that was designed by a dietitian. The nutrients in the diet were optimized for each individual, The third group was an exercise group. These participants worked with a personal trainer on an individualized exercise plan. The fourth group was the exercise and diet group. This group had both the dietitian and personal trainer intervention. After 3 weeks of treatment (or control), She measured their mental health with the Warwick-Edinburgh Mental Well-being Scale (WEMWBS), Some of the information is included in the ANOVA table below but I spilled a coffee on the output and the student already deleted the raw data... oh, no!! Given the ANOVA table below, what is the F-statistic? Source ss df MS F Between 1200.00 1800.00 Within Total OF= 9 50 OF = 19.00 OF= 12.67 O There is not enough information to determine F.

Chapter6: Systems Of Equations And Inequalities
Section: Chapter Questions
Problem 17PS: Cholesterol Cholesterol in human blood is necessary, but too much can lead to health problems. There...

Related questions
Question
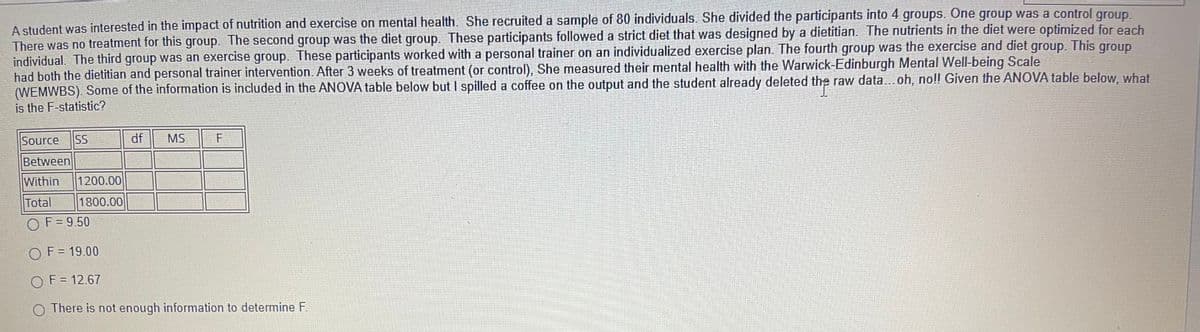
Transcribed Image Text:A student was interested in the impact of nutrition and exercise on mental health. She recruited a sample of 80 individuals. She divided the participants into 4 groups. One group was a control group.
There was no treatment for this group. The second group was the diet group. These participants followed a strict diet that was designed by a dietitian. The nutrients in the diet were optimized for each
individual. The third group was an exercise group. These participants worked with a personal trainer on an individualized exercise plan. The fourth group was the exercise and diet group. This group
had both the dietitian and personal trainer intervention. After 3 weeks of treatment (or control), She measured their mental health with the Warwick-Edinburgh Mental Well-being Scale
(WEMWBS). Some of the information is included in the ANOVA table below but I spilled a coffee on the output and the student already deleted the raw data...oh, no!! Given the ANOVA table below, what
is the F-statistic?
Source
SS
df
MS
Between
Within
1200.00
Total
1800.00
O
F = 9.50
O F= 19.00
O F = 12.67
O There is not enough information to determine F.
Expert Solution
This question has been solved!
Explore an expertly crafted, step-by-step solution for a thorough understanding of key concepts.

Step by step
Solved in 2 steps with 2 images

Recommended textbooks for you

Glencoe Algebra 1, Student Edition, 9780079039897…
Algebra
ISBN:
9780079039897
Author:
Carter
Publisher:
McGraw Hill
Glencoe Algebra 1, Student Edition, 9780079039897…
Algebra
ISBN:
9780079039897
Author:
Carter
Publisher:
McGraw Hill