A study conducted by Columbia University compared the cognitive ability of stroke patients three months after they'd been admitted to the hospital with a control group of those who had not had a stroke. The bar graph below is based on the study, and illustrates the number of errors made on a neuropsychological test by the patients who had had a stroke with those who had not had a stroke. Cognitive Impairment After Stroke 70 60 50 40 20 10 2 Number of Errors Made |Control Group Ostroke Patients The information and graph in this problem is based on the report found at http://www.ncbi.nlm.nih.gov/pmc/articles/PMC1072451/pdf/jnnpsyc00032-0074.pdf Use the bar graph to answer the following. a. How many stroke patients made no errors on the test? реople b. How many total members of the control group made 1, 2, or 3 errors on the test? реople c. How many fewer people from the control group made 6 errors on the test when compared to the group of stroke patients? people Frequency
A study conducted by Columbia University compared the cognitive ability of stroke patients three months after they'd been admitted to the hospital with a control group of those who had not had a stroke. The bar graph below is based on the study, and illustrates the number of errors made on a neuropsychological test by the patients who had had a stroke with those who had not had a stroke. Cognitive Impairment After Stroke 70 60 50 40 20 10 2 Number of Errors Made |Control Group Ostroke Patients The information and graph in this problem is based on the report found at http://www.ncbi.nlm.nih.gov/pmc/articles/PMC1072451/pdf/jnnpsyc00032-0074.pdf Use the bar graph to answer the following. a. How many stroke patients made no errors on the test? реople b. How many total members of the control group made 1, 2, or 3 errors on the test? реople c. How many fewer people from the control group made 6 errors on the test when compared to the group of stroke patients? people Frequency

Glencoe Algebra 1, Student Edition, 9780079039897, 0079039898, 2018
18th Edition
ISBN:9780079039897
Author:Carter
Publisher:Carter
Chapter10: Statistics
Section10.3: Measures Of Spread
Problem 1GP

Related questions
Question
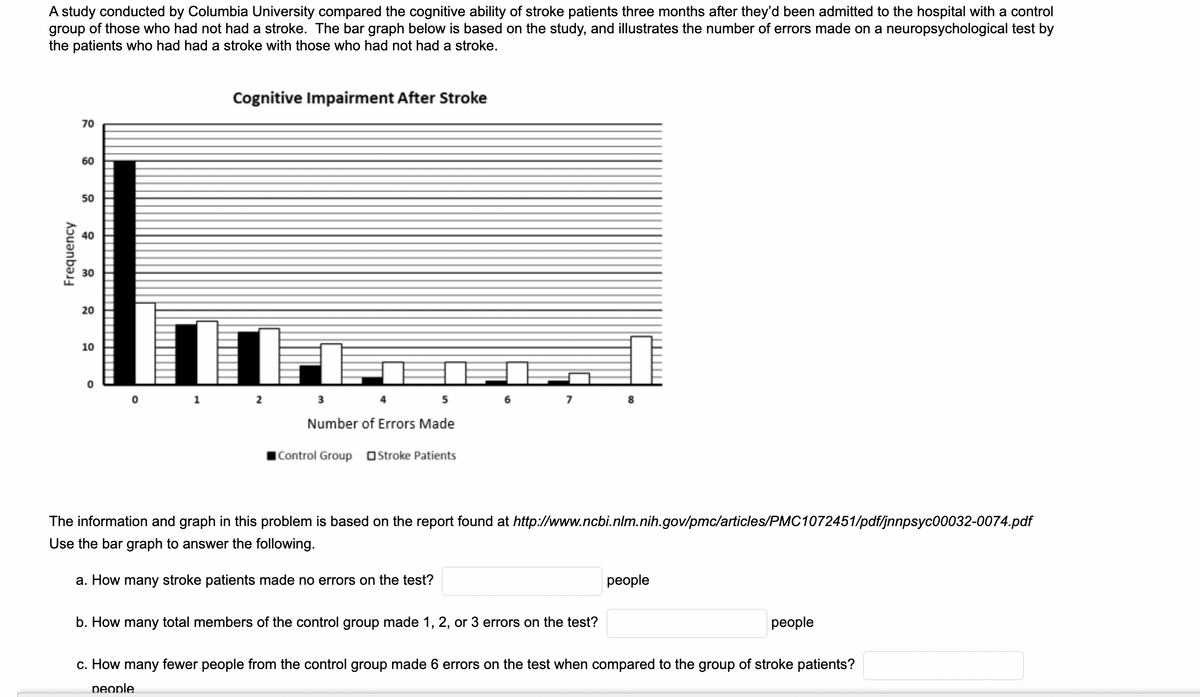
Transcribed Image Text:A study conducted by Columbia University compared the cognitive ability of stroke patients three months after they'd been admitted to the hospital with a control
group of those who had not had a stroke. The bar graph below is based on the study, and illustrates the number of errors made on a neuropsychological test by
the patients who had had a stroke with those who had not had a stroke.
Cognitive Impairment After Stroke
70
..
60
50
40
30
20
10
Number of Errors Made
Control Group OsStroke Patients
The information and graph in this problem is based on the report found at http://www.ncbi.nlm.nih.gov/pmc/articles/PMC1072451/pdf/jnnpsyc00032-0074.pdf
Use the bar graph to answer the following.
a. How many stroke patients made no errors on the test?
реople
b. How many total members of the control group made 1, 2, or 3 errors on the test?
реople
c. How many fewer people from the control group made 6 errors on the test when compared to the group of stroke patients?
people
Frequency
Expert Solution
This question has been solved!
Explore an expertly crafted, step-by-step solution for a thorough understanding of key concepts.

Step by step
Solved in 2 steps with 2 images

Recommended textbooks for you
Glencoe Algebra 1, Student Edition, 9780079039897…
Algebra
ISBN:
9780079039897
Author:
Carter
Publisher:
McGraw Hill

Holt Mcdougal Larson Pre-algebra: Student Edition…
Algebra
ISBN:
9780547587776
Author:
HOLT MCDOUGAL
Publisher:
HOLT MCDOUGAL
Glencoe Algebra 1, Student Edition, 9780079039897…
Algebra
ISBN:
9780079039897
Author:
Carter
Publisher:
McGraw Hill
Holt Mcdougal Larson Pre-algebra: Student Edition…
Algebra
ISBN:
9780547587776
Author:
HOLT MCDOUGAL
Publisher:
HOLT MCDOUGAL