What was the sample size for this simple regression analysis? Analysis of Variance Sum of Source DF Squares Mean Square F Ratio Model 1 2632.8012 2632.80 23.2115 Error 54 6125.0381 113.43 Prob > F C. Total 55 8757.8393 <.0001* Parameter Estimates Term Estimate Std Error t Ratio Prob>[t| Lower 95% Upper 95 Intercept 31.738559 10.26099 Midterm 3.09 0.0031* 11.166522 52.31059 0.61916 0.128514 4.82 <.0001* 0.3615044 0.876815
What was the sample size for this simple regression analysis? Analysis of Variance Sum of Source DF Squares Mean Square F Ratio Model 1 2632.8012 2632.80 23.2115 Error 54 6125.0381 113.43 Prob > F C. Total 55 8757.8393 <.0001* Parameter Estimates Term Estimate Std Error t Ratio Prob>[t| Lower 95% Upper 95 Intercept 31.738559 10.26099 Midterm 3.09 0.0031* 11.166522 52.31059 0.61916 0.128514 4.82 <.0001* 0.3615044 0.876815

Glencoe Algebra 1, Student Edition, 9780079039897, 0079039898, 2018
18th Edition
ISBN:9780079039897
Author:Carter
Publisher:Carter
Chapter10: Statistics
Section10.3: Measures Of Spread
Problem 1GP

Related questions
Question
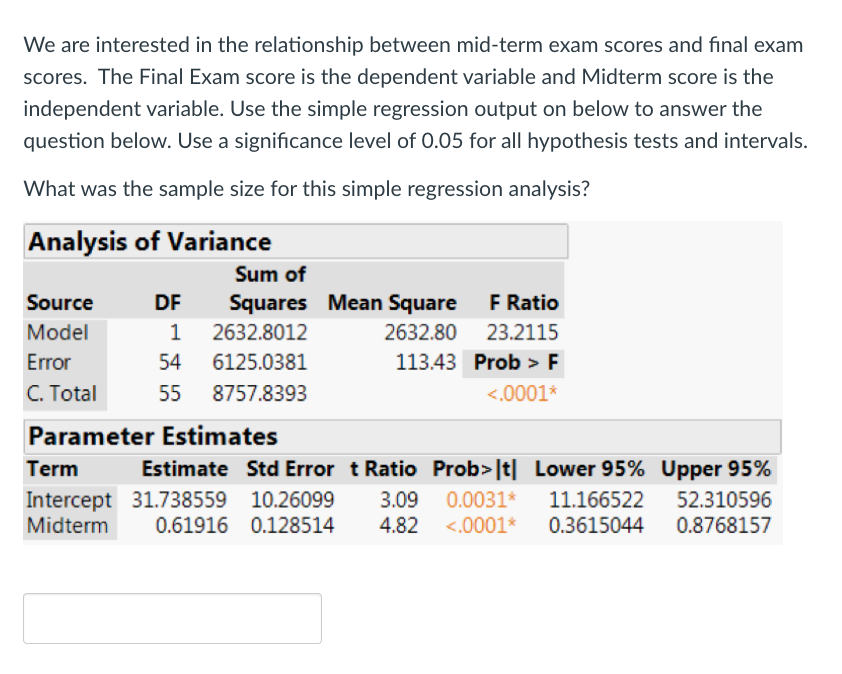
Transcribed Image Text:We are interested in the relationship between mid-term exam scores and final exam
scores. The Final Exam score is the dependent variable and Midterm score is the
independent variable. Use the simple regression output on below to answer the
question below. Use a significance level of 0.05 for all hypothesis tests and intervals.
What was the sample size for this simple regression analysis?
Analysis of Variance
Sum of
Source
DF
Squares Mean Square
F Ratio
Model
1
2632.8012
2632.80
23.2115
Error
54
6125.0381
113.43 Prob > F
C. Total
55
8757.8393
<.0001*
Parameter Estimates
Term
Estimate Std Error t Ratio Prob>|t| Lower 95% Upper 95%
Intercept 31.738559 10.26099
Midterm
3.09 0.0031*
11.166522
52.310596
0.8768157
0.61916 0.128514
4.82 <.0001*
0.3615044
Expert Solution
This question has been solved!
Explore an expertly crafted, step-by-step solution for a thorough understanding of key concepts.

Step by step
Solved in 2 steps

Recommended textbooks for you
Glencoe Algebra 1, Student Edition, 9780079039897…
Algebra
ISBN:
9780079039897
Author:
Carter
Publisher:
McGraw Hill
Glencoe Algebra 1, Student Edition, 9780079039897…
Algebra
ISBN:
9780079039897
Author:
Carter
Publisher:
McGraw Hill