A study conducted in a small company yielded the results shown in the following table Age Insurance No Insurance less than 25 12 17 The expected number people who have insurance from the "45-65" age group is OA. none of the other answers OB. 20.777 OC. 289 O D. 19 OE. 0.137% 25-45 45 27 45-65 19 19
A study conducted in a small company yielded the results shown in the following table Age Insurance No Insurance less than 25 12 17 The expected number people who have insurance from the "45-65" age group is OA. none of the other answers OB. 20.777 OC. 289 O D. 19 OE. 0.137% 25-45 45 27 45-65 19 19

Chapter8: Sequences, Series,and Probability
Section8.7: Probability
Problem 11ECP: A manufacturer has determined that a machine averages one faulty unit for every 500 it produces....

Related questions
Question
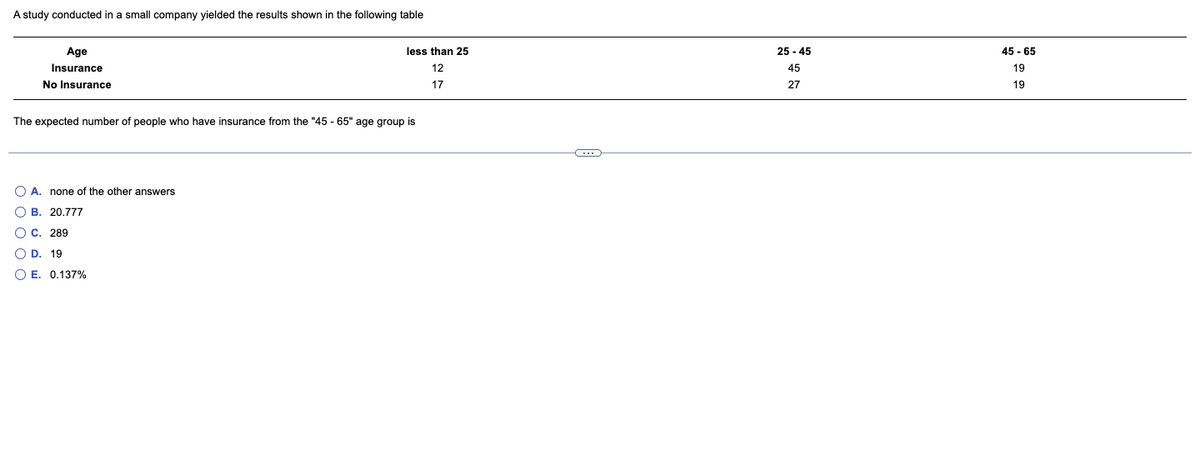
Transcribed Image Text:A study conducted in a small company yielded the results shown in the following table
Age
Insurance
No Insurance
The expected number of people who have insurance from the "45 - 65" age group is
A. none of the other answers
less than 25
12
17
OB. 20.777
OC. 289
O D. 19
OE. 0.137%
C
25-45
45
27
45-65
19
19
Expert Solution
This question has been solved!
Explore an expertly crafted, step-by-step solution for a thorough understanding of key concepts.

Step by step
Solved in 2 steps with 1 images

Recommended textbooks for you

Holt Mcdougal Larson Pre-algebra: Student Edition…
Algebra
ISBN:
9780547587776
Author:
HOLT MCDOUGAL
Publisher:
HOLT MCDOUGAL
Holt Mcdougal Larson Pre-algebra: Student Edition…
Algebra
ISBN:
9780547587776
Author:
HOLT MCDOUGAL
Publisher:
HOLT MCDOUGAL