Question 12 Which of the following is the equation of the relationship between the predictor variable (x) and the response variable (y)? A y = 25.707 +0.9887x By= 29.796 +0.5897x C y = 25.707 +0.5897x D y = 29.796 +0.9887x Question 13 Determine the Pearson Correlation Coefficient. A 0.5897 B 0.8459 C 0.7155 D 0.9887
Question 12 Which of the following is the equation of the relationship between the predictor variable (x) and the response variable (y)? A y = 25.707 +0.9887x By= 29.796 +0.5897x C y = 25.707 +0.5897x D y = 29.796 +0.9887x Question 13 Determine the Pearson Correlation Coefficient. A 0.5897 B 0.8459 C 0.7155 D 0.9887

Glencoe Algebra 1, Student Edition, 9780079039897, 0079039898, 2018
18th Edition
ISBN:9780079039897
Author:Carter
Publisher:Carter
Chapter10: Statistics
Section10.5: Comparing Sets Of Data
Problem 14PPS

Related questions
Question
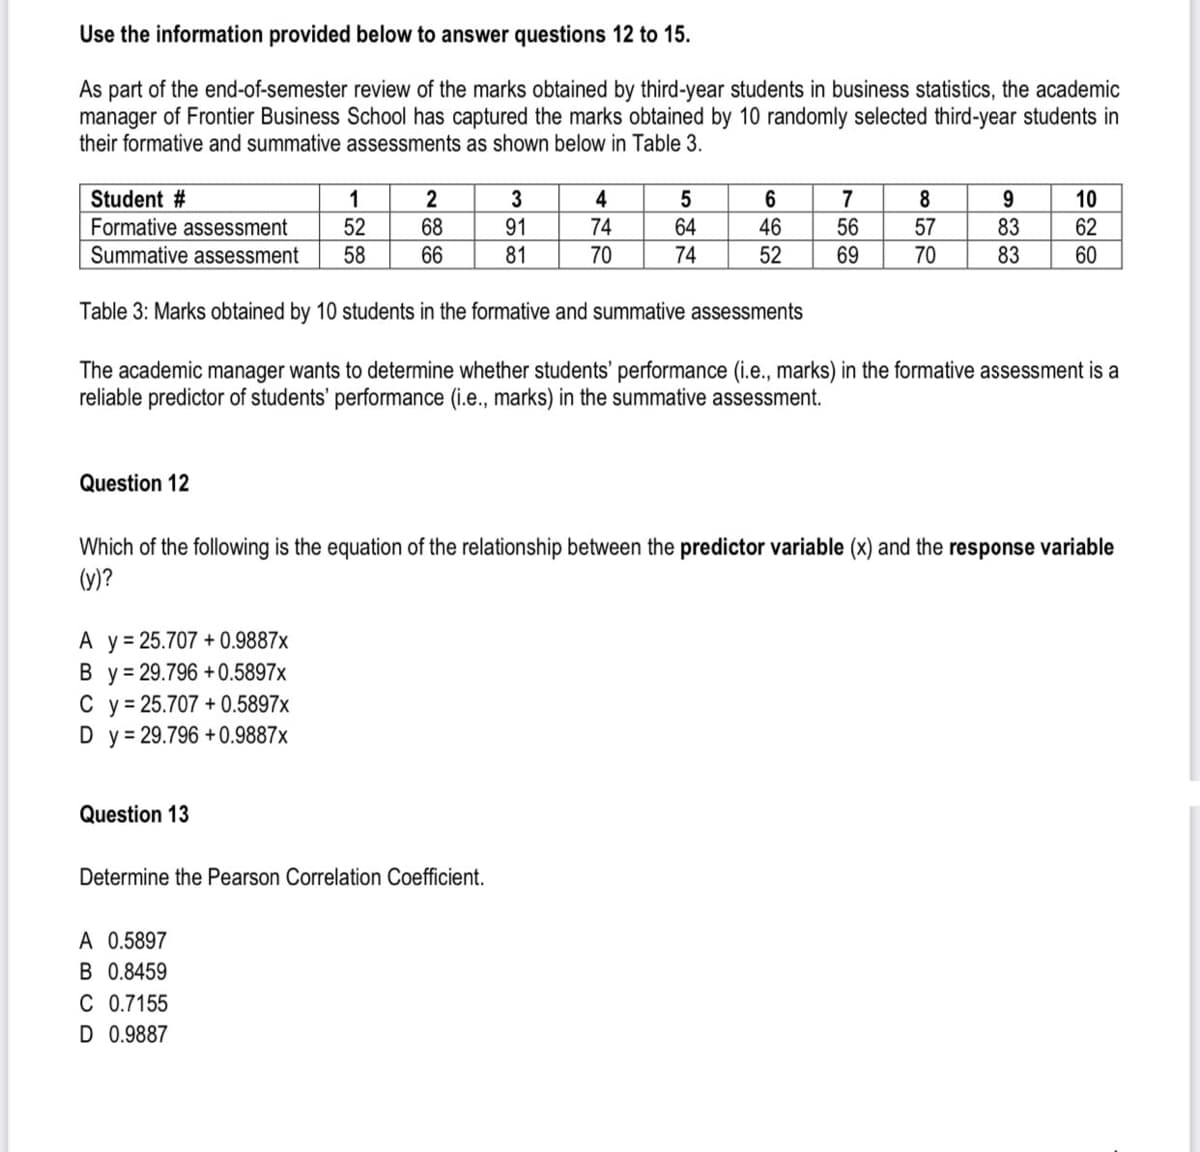
Transcribed Image Text:Use the information provided below to answer questions 12 to 15.
As part of the end-of-semester review of the marks obtained by third-year students in business statistics, the academic
manager of Frontier Business School has captured the marks obtained by 10 randomly selected third-year students in
their formative and summative assessments as shown below in Table 3.
Student #
Formative assessment
Summative assessment
Question 12
A y = 25.707 +0.9887x
By= 29.796 +0.5897x
C y = 25.707 +0.5897x
D y = 29.796 +0.9887x
1
52
58
Question 13
2
68
66
A 0.5897
B 0.8459
C 0.7155
D 0.9887
3
91
81
Determine the Pearson Correlation Coefficient.
4
74
70
5
64
74
6
46
52
Table 3: Marks obtained by 10 students in the formative and summative assessments
The academic manager wants to determine whether students' performance (i.e., marks) in the formative assessment is a
reliable predictor of students' performance (i.e., marks) in the summative assessment.
7
56
69
8
57
70
Which of the following is the equation of the relationship between the predictor variable (x) and the response variable
(y)?
9
83
83
10
62
60
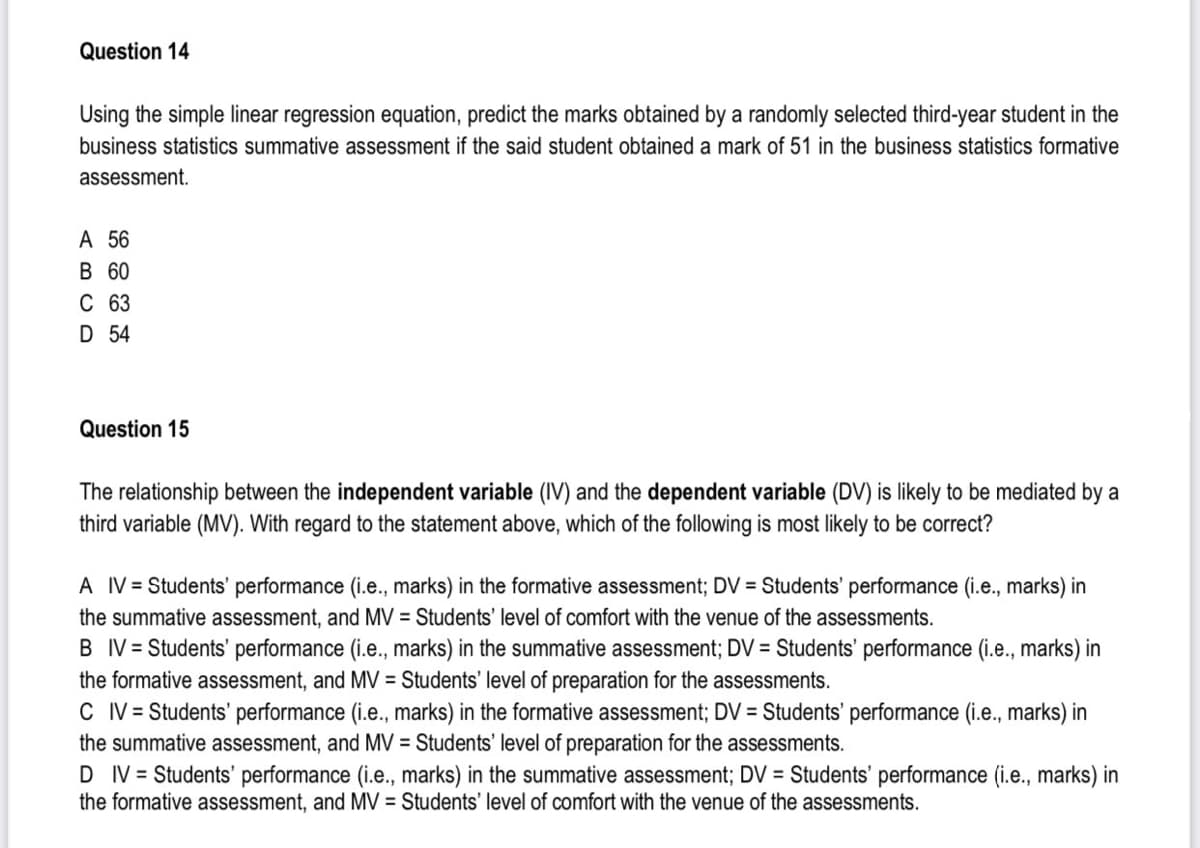
Transcribed Image Text:Question 14
Using the simple linear regression equation, predict the marks obtained by a randomly selected third-year student in the
business statistics summative assessment if the said student obtained a mark of 51 in the business statistics formative
assessment.
A 56
B 60
C 63
D 54
Question 15
The relationship between the independent variable (IV) and the dependent variable (DV) is likely to be mediated by a
third variable (MV). With regard to the statement above, which of the following is most likely to be correct?
A IV = Students' performance (i.e., marks) in the formative assessment; DV = Students' performance (i.e., marks) in
the summative assessment, and MV = Students' level of comfort with the venue of the assessments.
B IV = Students' performance (i.e., marks) in the summative assessment; DV = Students' performance (i.e., marks) in
the formative assessment, and MV = Students' level of preparation for the assessments.
C IV = Students' performance (i.e., marks) in the formative assessment; DV = Students' performance (i.e., marks) in
the summative assessment, and MV = Students' level of preparation for the assessments.
D IV = Students' performance (i.e., marks) in the summative assessment; DV = Students' performance (i.e., marks) in
the formative assessment, and MV = Students' level of comfort with the venue of the assessments.
Expert Solution
This question has been solved!
Explore an expertly crafted, step-by-step solution for a thorough understanding of key concepts.

Step by step
Solved in 3 steps with 1 images

Recommended textbooks for you
Glencoe Algebra 1, Student Edition, 9780079039897…
Algebra
ISBN:
9780079039897
Author:
Carter
Publisher:
McGraw Hill
Glencoe Algebra 1, Student Edition, 9780079039897…
Algebra
ISBN:
9780079039897
Author:
Carter
Publisher:
McGraw Hill