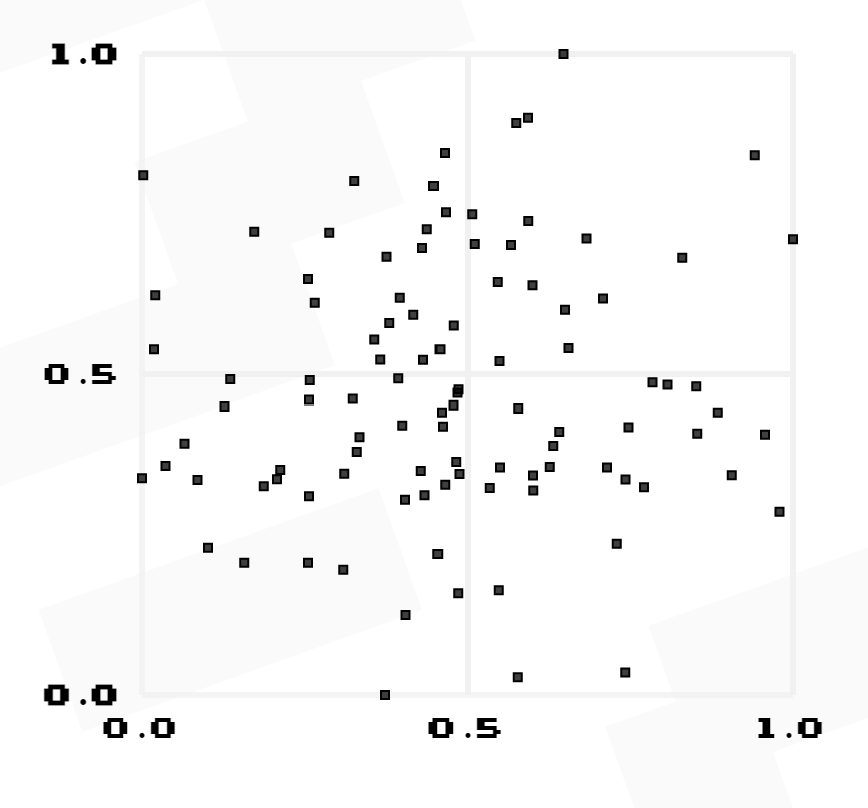
Which of the following values is most likely to represent the correlation coefficient for the data shown in this scatterplot? a. r = .06 b. r = .90 c. r = -.10 d. r = .67
Which of the following values is most likely to represent the correlation coefficient for the data shown in this scatterplot? a. r = .06 b. r = .90 c. r = -.10 d. r = .67

Mathematics For Machine Technology
8th Edition
ISBN:9781337798310
Author:Peterson, John.
Publisher:Peterson, John.
Chapter69: Simple Practical Machine Applications
Section: Chapter Questions
Problem 3A: Determine sec 14.8527 rounded to 5 decimal places.

Related questions
Question
Which of the following values is most likely to represent the
a. r = .06
b. r = .90
c. r = -.10
d. r = .67
Transcribed Image Text:1.0
■
☐
☐
☐
☐
■
·
☐
☐
☐☐
■
☐
0.5
·
☐
☐
☐
☐☐
■
C
■
☐
☐
☐
☐
■
☐
☐
☐
0.0
1.0
0.5
0.0
Expert Solution
This question has been solved!
Explore an expertly crafted, step-by-step solution for a thorough understanding of key concepts.

Step by step
Solved in 2 steps

Recommended textbooks for you
Mathematics For Machine Technology
Advanced Math
ISBN:
9781337798310
Author:
Peterson, John.
Publisher:
Cengage Learning,
Mathematics For Machine Technology
Advanced Math
ISBN:
9781337798310
Author:
Peterson, John.
Publisher:
Cengage Learning,