A study was done to look at the relationship between number of vacation days employees take each yean and the number of sick days they take each year. The results of the survey are shown below. Vacation Days 4. 13 4. 13 8 6. 1 14 12 Sick Days 6. 1 3 4 4. 4. a. Find the correlation coefficient: r = Round to 2 decimal places.
A study was done to look at the relationship between number of vacation days employees take each yean and the number of sick days they take each year. The results of the survey are shown below. Vacation Days 4. 13 4. 13 8 6. 1 14 12 Sick Days 6. 1 3 4 4. 4. a. Find the correlation coefficient: r = Round to 2 decimal places.

Functions and Change: A Modeling Approach to College Algebra (MindTap Course List)
6th Edition
ISBN:9781337111348
Author:Bruce Crauder, Benny Evans, Alan Noell
Publisher:Bruce Crauder, Benny Evans, Alan Noell
Chapter5: A Survey Of Other Common Functions
Section5.6: Higher-degree Polynomials And Rational Functions
Problem 1TU: The following fictitious table shows kryptonite price, in dollar per gram, t years after 2006. t=...

Related questions
Question
I need help only to fill in the blank answet boxes.
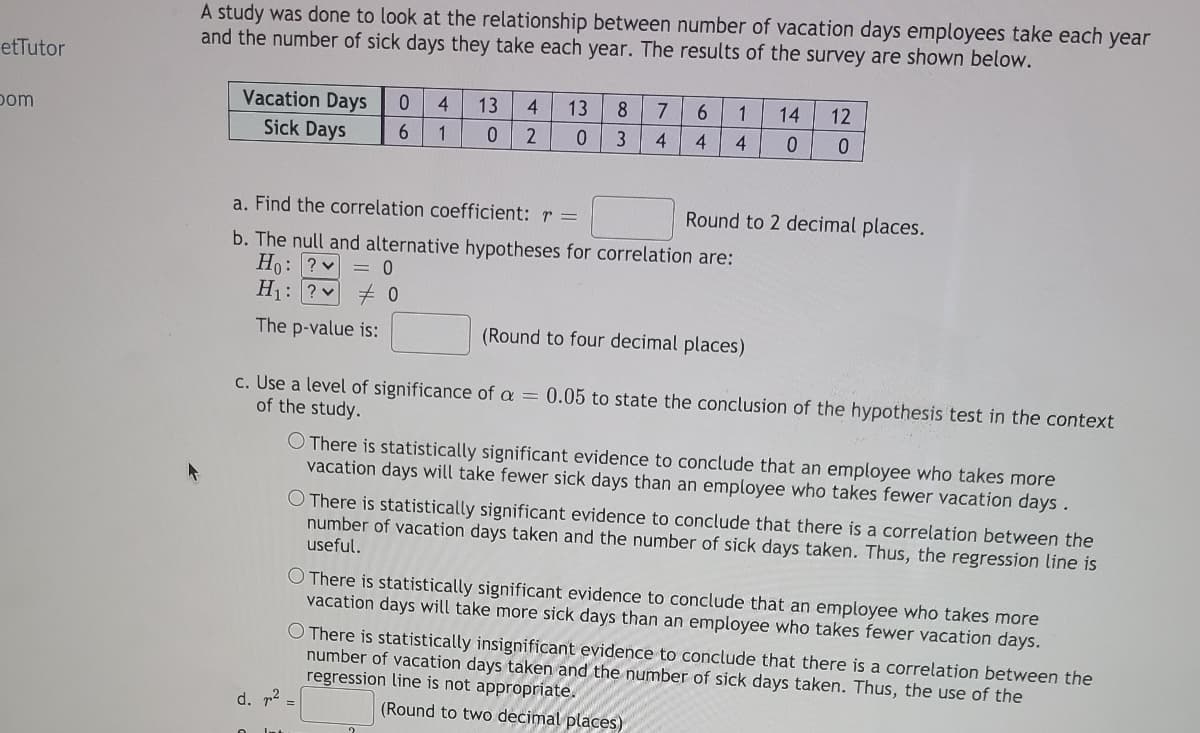
Transcribed Image Text:A study was done to look at the relationship between number of vacation days employees take each year
and the number of sick days they take each year. The results of the survey are shown below.
etTutor
Vacation Days
4
13
4
13
8.
7.
14
12
oom
Sick Days
6.
1
3
4
4.
4.
a. Find the correlation coefficient: r =
Round to 2 decimal places.
b. The null and alternative hypotheses for correlation are:
Ho: ? v
H1: ?v
= 0
The p-value is:
(Round to four decimal places)
c. Use a level of significance of a =
of the study.
0.05 to state the conclusion of the hypothesis test in the context
O There is statistically significant evidence to conclude that an employee who takes more
vacation days will take fewer sick days than an employee who takes fewer vacation days.
O There is statistically significant evidence to conclude that there is a correlation between the
number of vacation days taken and the number of sick days taken. Thus, the regression line is
useful.
O There is statistically significant evidence to conclude that an employee who takes more
vacation days will take more sick days than an employee who takes fewer vacation days.
O There is statistically insignificant evidence to conclude that there is a correlation between the
number of vacation days taken and the number of sick days taken. Thus, the use of the
regression line is not appropriate.
d. 12
(Round to two decimal places)
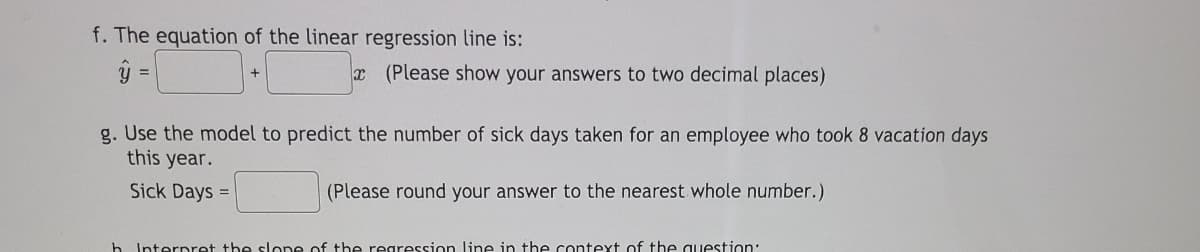
Transcribed Image Text:f. The equation of the linear regression line is:
y =
x (Please show your answers to two decimal places)
g. Use the model to predict the number of sick days taken for an employee who took 8 vacation days
this year.
Sick Days =
(Please round your answer to the nearest whole number.)
h. Interpret the slone of the regression line in the context of the question:
Expert Solution
This question has been solved!
Explore an expertly crafted, step-by-step solution for a thorough understanding of key concepts.

This is a popular solution!

Trending now
This is a popular solution!

Step by step
Solved in 3 steps

Knowledge Booster


Learn more about
Need a deep-dive on the concept behind this application? Look no further. Learn more about this topic, statistics and related others by exploring similar questions and additional content below.Recommended textbooks for you
Functions and Change: A Modeling Approach to Coll…
Algebra
ISBN:
9781337111348
Author:
Bruce Crauder, Benny Evans, Alan Noell
Publisher:
Cengage Learning

Algebra & Trigonometry with Analytic Geometry
Algebra
ISBN:
9781133382119
Author:
Swokowski
Publisher:
Cengage

Functions and Change: A Modeling Approach to Coll…
Algebra
ISBN:
9781337111348
Author:
Bruce Crauder, Benny Evans, Alan Noell
Publisher:
Cengage Learning
Algebra & Trigonometry with Analytic Geometry
Algebra
ISBN:
9781133382119
Author:
Swokowski
Publisher:
Cengage

Algebra and Trigonometry (MindTap Course List)
Algebra
ISBN:
9781305071742
Author:
James Stewart, Lothar Redlin, Saleem Watson
Publisher:
Cengage Learning

Algebra: Structure And Method, Book 1
Algebra
ISBN:
9780395977224
Author:
Richard G. Brown, Mary P. Dolciani, Robert H. Sorgenfrey, William L. Cole
Publisher:
McDougal Littell